For those who like to dig 'deeper'!
Pro Punter Form Feature Set:
Upcoming Meeting Race List:


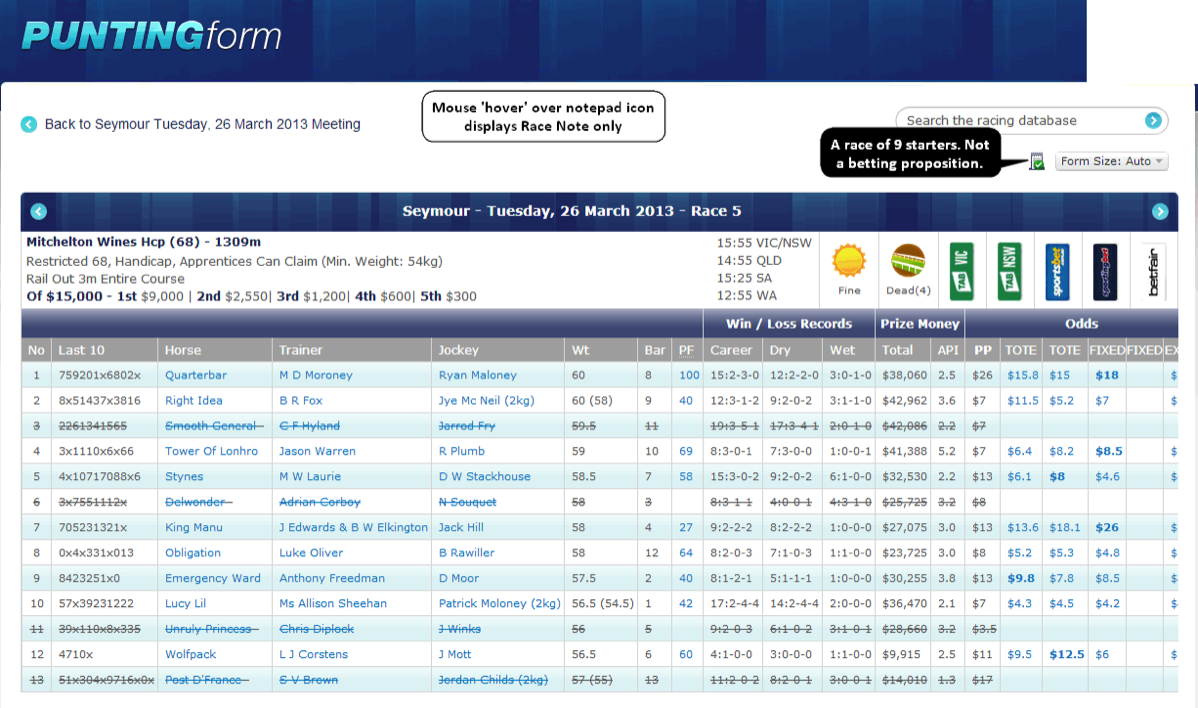
A card of races for an upcoming meeting is displayed by selecting a meeting from the list of available meetings under the main 'Form' menu.
Track conditions, Scratchings and Gear changes for the meeting are also shown on this page.
Track conditions, Scratchings and Gear changes for the meeting are also shown on this page.
Note: The image shown above can be enlarged and then still further magnified screenshots brought into view using the *slider* controls overlaid on the image.
Field for Upcoming Race - Standard View:


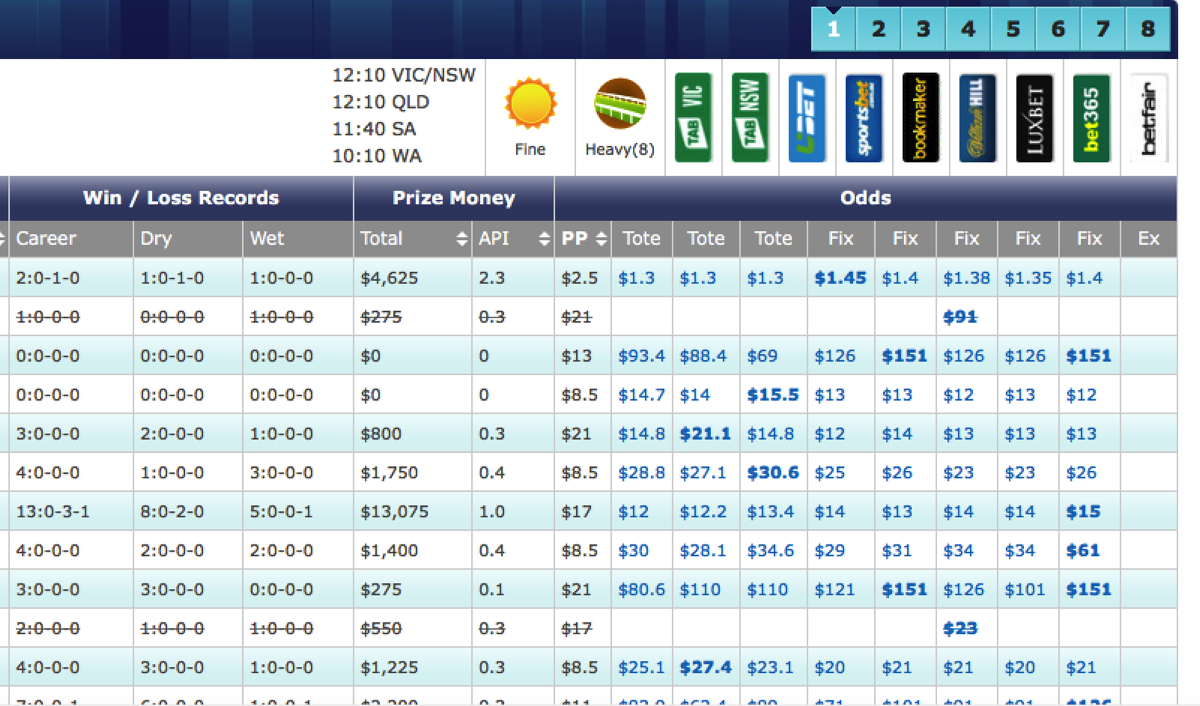

Clicking on a race link from the 'Meeting Race List' reveals a Field table for an 'Upcoming Race'. There are two 'radio' buttons which determine what columns are displayed in this table; 'Standard View' and 'Key Data View'.
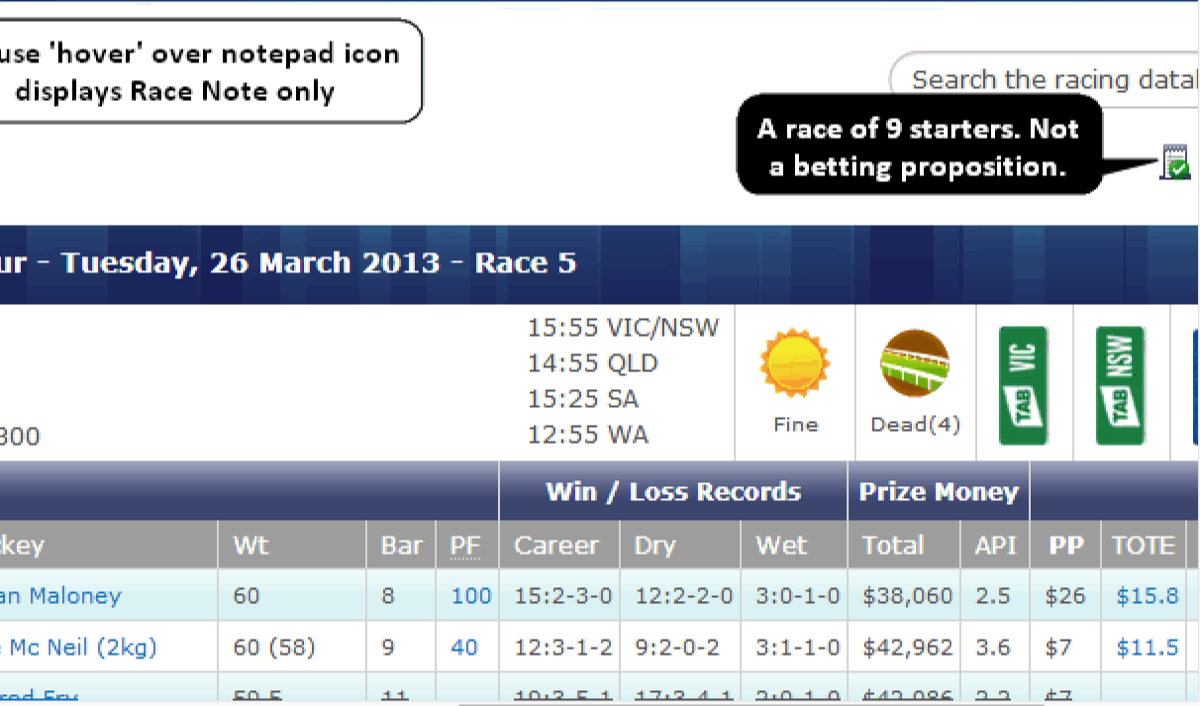
'Standard View' shows standard form data and the Odds Comparison table.
'Standard View' shows standard form data and the Odds Comparison table.
Note: The image shown above can be enlarged and then still further magnified screenshots brought into view using the *slider* controls overlaid on the image.
| Column Heading | Description |
| PF | Requires a MQG Ratings subscription … Short for PFScore. This encompasses four rating types and takes the form of a 'consensus score' from 0 to 100. How each runner has 'ranked' in each of the four rating categories (or three where there is no sectional rating available) contributes to the final consensus score. The four rating types used are; Neural, Overall Time, Sectional (L600) Time and Weight (or Class) ratings. |
| API | Average Prize Money Index (,000). Equals total career prize money divided by the total career starts. i.e. $,000/Start |
| PP | Pre Post Price. A 'newspaper' style indicative pre post price. |
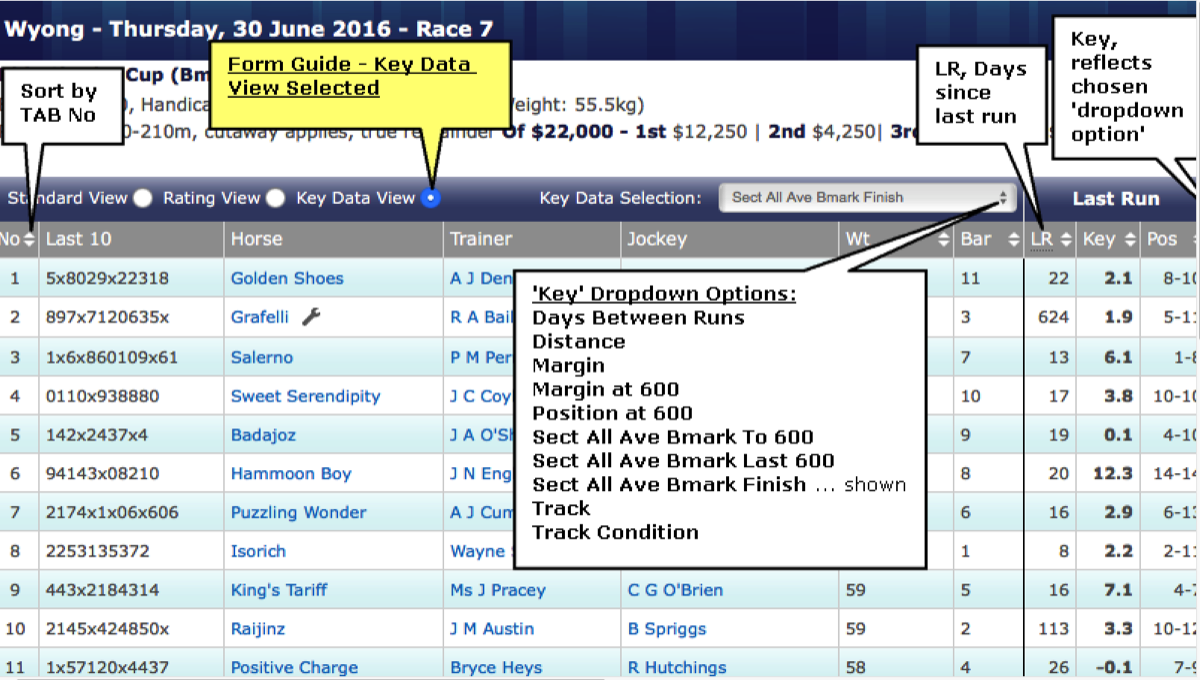
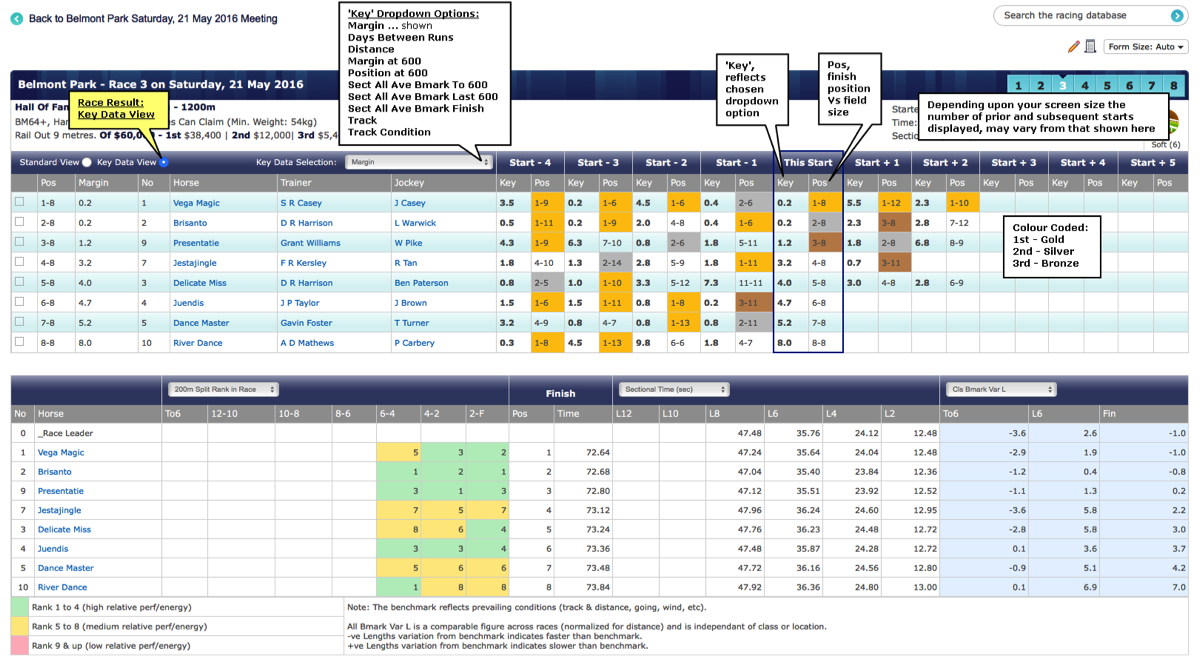
Field for Upcoming Race - Key Data View:


Key Data View enables 'key' data about each runner to be compared for up to 10 previous starts. The 'Key' can be changed by choosing a form variable from the drop-down as indicated. Exactly what form variables are available depends upon your level of subscription. The Pos (position) column shown for each start cannot be changed and shows the finished position against field size.
Note: The image shown above can be enlarged and then still further magnified screenshots brought into view using the *slider* controls overlaid on the image.
Horse Form For Upcoming Race:


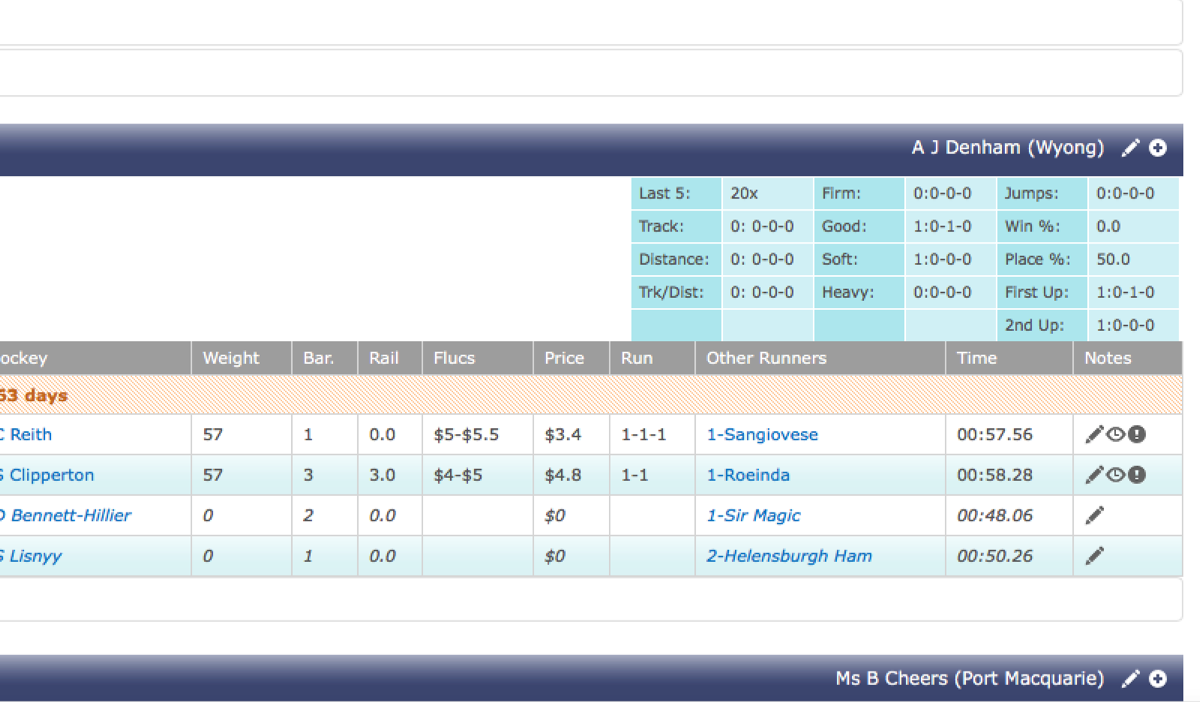
Horse Form for each runner in an upcoming race appears below the Race Field table and corresponding Speed Map.
Clicking on the 'Filters' and 'Options' links allows the Form display to be customised. Likewise, clicking on any displayed 'Form Links' will show comparative data for when runners have met in the past.
Clicking on the 'Filters' and 'Options' links allows the Form display to be customised. Likewise, clicking on any displayed 'Form Links' will show comparative data for when runners have met in the past.
Note: The image shown above can be enlarged and then still further magnified screenshots brought into view using the *slider* controls overlaid on the image.
Form Display - Filters & Options


The 'Filters' and 'Options' Links allow for customisation of the Form display.
Filters include; track category and condition, race distance and wins/placings only. Options include; permanently expand any 'form links', colour code track cond, spells / letups / freshens, barrier trials and number of starts to display.
Filters include; track category and condition, race distance and wins/placings only. Options include; permanently expand any 'form links', colour code track cond, spells / letups / freshens, barrier trials and number of starts to display.
Note: The image shown above can be enlarged and then still further magnified screenshots brought into view using the *slider* controls overlaid on the image.
Form Links:


For a given field of runners any 'Form Links' which exist between runners over previous races, will be displayed by the 'Form Links' icon. Clicking the Link will 'expand' the prior race contests (if not already expanded under form options).
Margins, weights (and relative weight changes), barriers and pricing information, corresponding to the prior starts when the horses met, is shown.
Margins, weights (and relative weight changes), barriers and pricing information, corresponding to the prior starts when the horses met, is shown.
Note: The image shown above can be enlarged and then still further magnified screenshots brought into view using the *slider* controls overlaid on the image.
Horse Career:
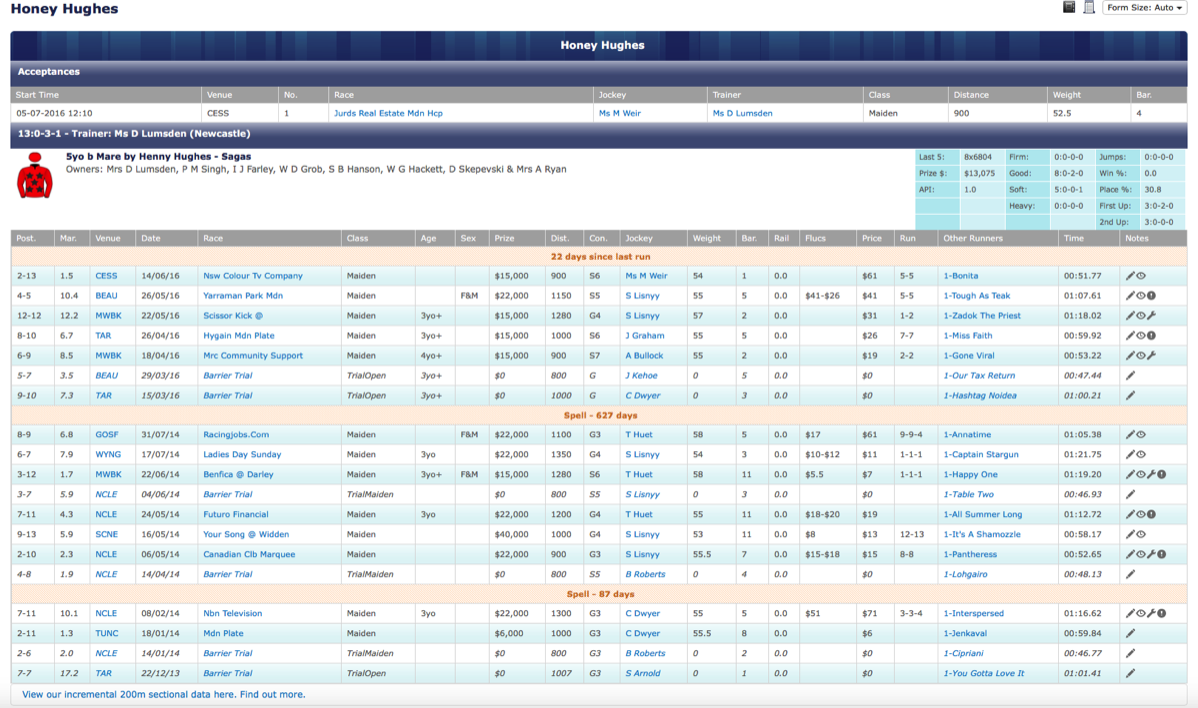


'Horse Career' information is displayed by clinking on any of the Horse Name links in our form guide. It has a similar format to the 'horse form' which appears for an upcoming race, but shows all career starts.
Acceptances for any upcoming races are also shown.
Acceptances for any upcoming races are also shown.
Note: The image shown above can be enlarged and then still further magnified screenshots brought into view using the *slider* controls overlaid on the image.
Meeting Results:
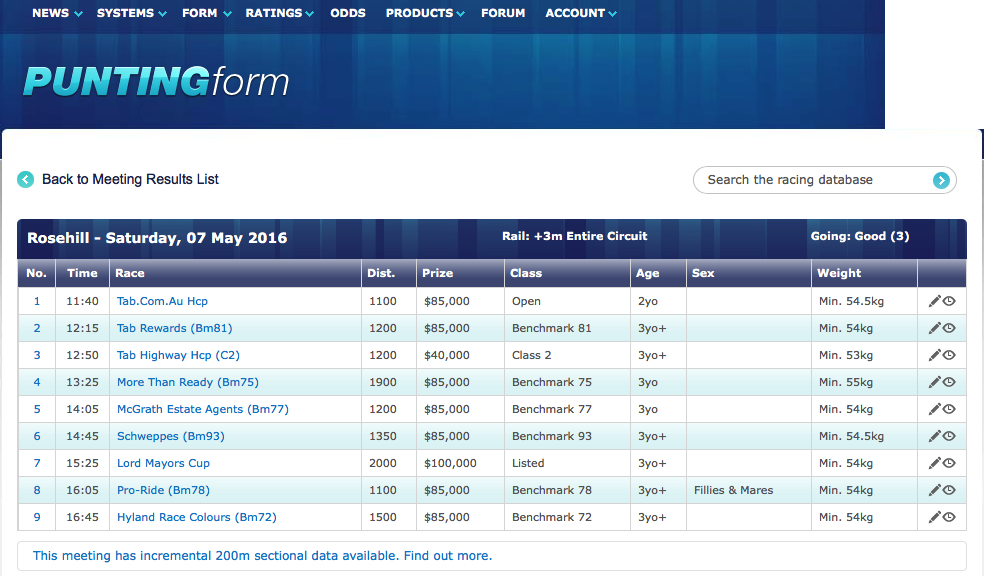
The 'Meeting Results' Table shows details for each race on the card and provides a link to call up each race result individually.
Note: The image shown above can be enlarged by clicking on the magnifying glass.
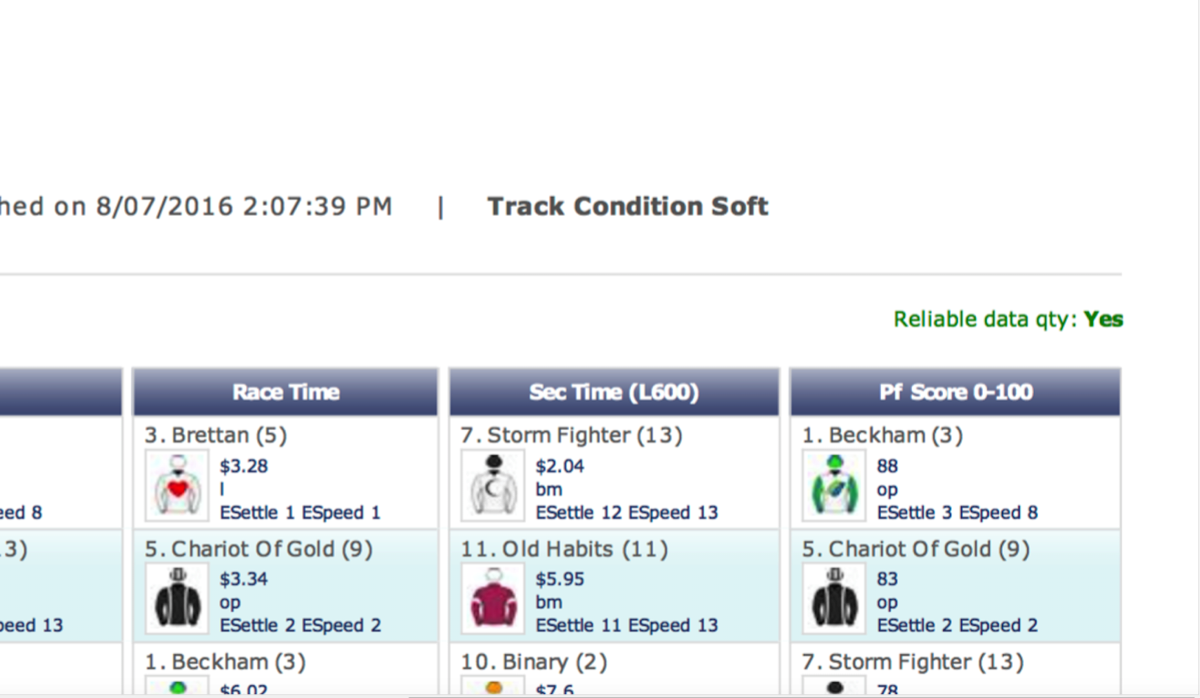
Race Results - Standard View:


The 'Race Results' page is accessed by clicking on a race hyperlink in the 'Meeting Results' Table. There are two 'radio' buttons which determine what columns are displayed in the Race Results Table; 'Standard View' and 'Key Data View'.
'Standard View' shows std results data including finish position, margins, pir and price details.
'Standard View' shows std results data including finish position, margins, pir and price details.
Note: The image shown above can be enlarged and then still further magnified screenshots brought into view using the *slider* controls overlaid on the image.
Race Results - Key Data View:


Key Data View enables 'key' data about each runner to be compared for up to 4 previous starts, 'This Start', and up to 5 subsequent starts. The 'Key' can be changed by choosing a form variable from the drop-down. Exactly what form variables are available depends upon your level of subscription. The Pos column shows the finished position against field size and is colour coded for 1st, 2nd and 3rd placings.
Note: The image shown above can be enlarged and then still further magnified screenshots brought into view using the *slider* controls overlaid on the image.
'User' Hierarchical Run, Horse and Race Notes:

A unique 'hierarchical' structure of Run Notes, Horse Notes and Race Notes has been implemented for Pro Form subscribers. This has the benefit of being able to organize and display ‘user created’ notes according to the relationships which exist between them. Please note that the ‘actual notes’ shown here were created for illustration purposes only.
The ‘note-action’ icons to look for throughout our digital Formguide are shown.
The ‘note-action’ icons to look for throughout our digital Formguide are shown.
Note: The images shown on this page can be enlarged and then still further magnified screenshots brought into view using the *slider* controls overlaid on the image.


The Race Field Formguide Page - Runner Details View:
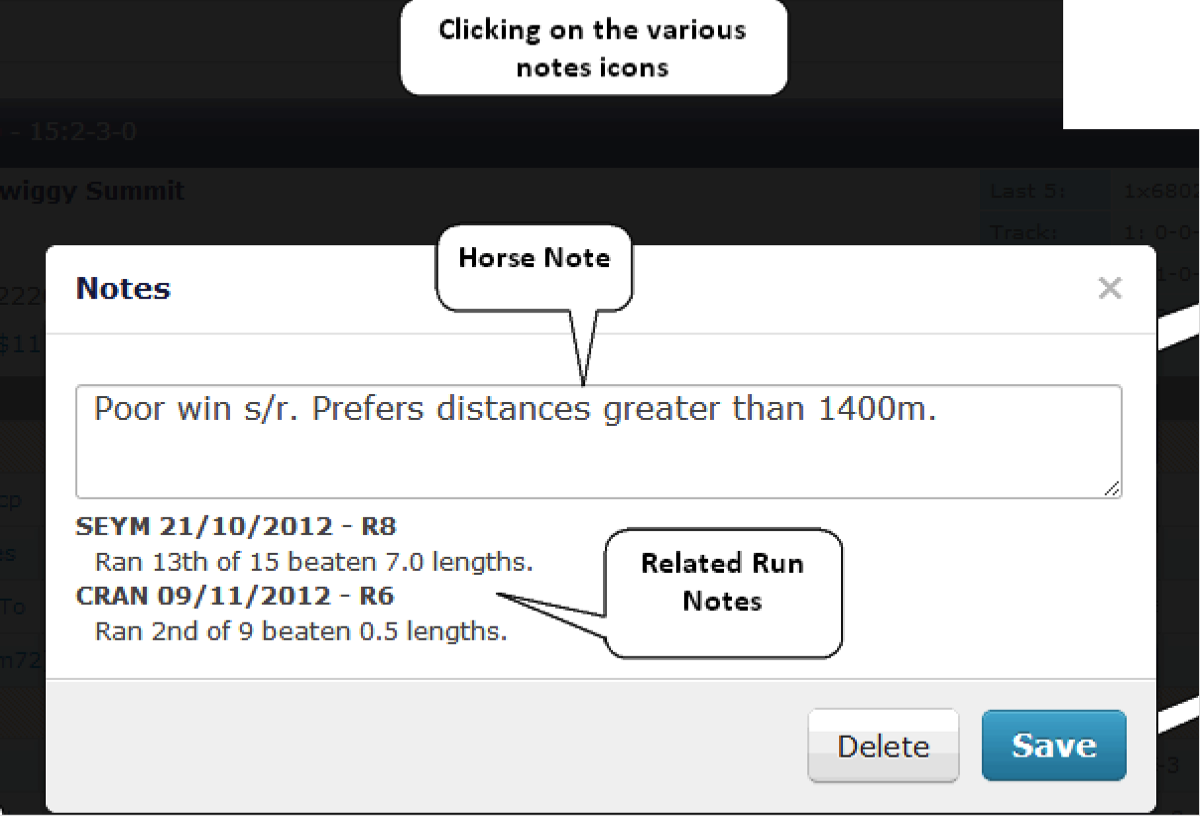
The most fundamental note is a 'Run Note'. Run Notes are always related to Horse Notes (the next level of hierarchy).
'Mouse hover' over run note icon actions are shown.
The most fundamental note is a 'Run Note'. Run Notes are always related to Horse Notes (the next level of hierarchy).
'Mouse hover' over run note icon actions are shown.

The Race Field Formguide Page - Runner Details View: continued
'Click' on run note icon actions are shown.
'Click' on run note icon actions are shown.
The Race Field Formguide Page - Race Details View:
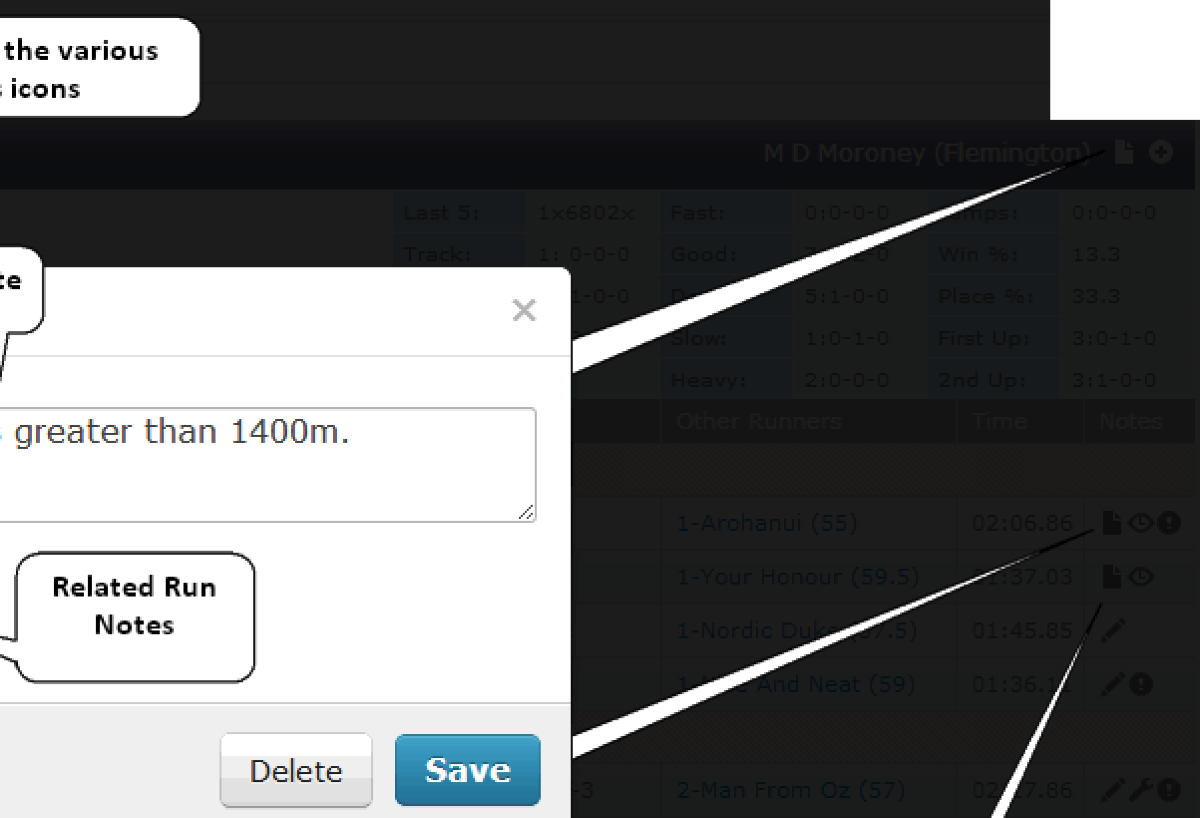
The highest form of note is the 'Race Note'. Race Notes always display any related Horse Notes (and any Run Notes related to the listed horses can be expanded or collapsed by clicking on the horse names).
'Mouse hover' over race note icon action is shown.
The highest form of note is the 'Race Note'. Race Notes always display any related Horse Notes (and any Run Notes related to the listed horses can be expanded or collapsed by clicking on the horse names).
'Mouse hover' over race note icon action is shown.


The Race Field Formguide Page - Race Details View: continued
'Click' on race note icon action is shown.
'Click' on race note icon action is shown.


The Horse Details Page View:
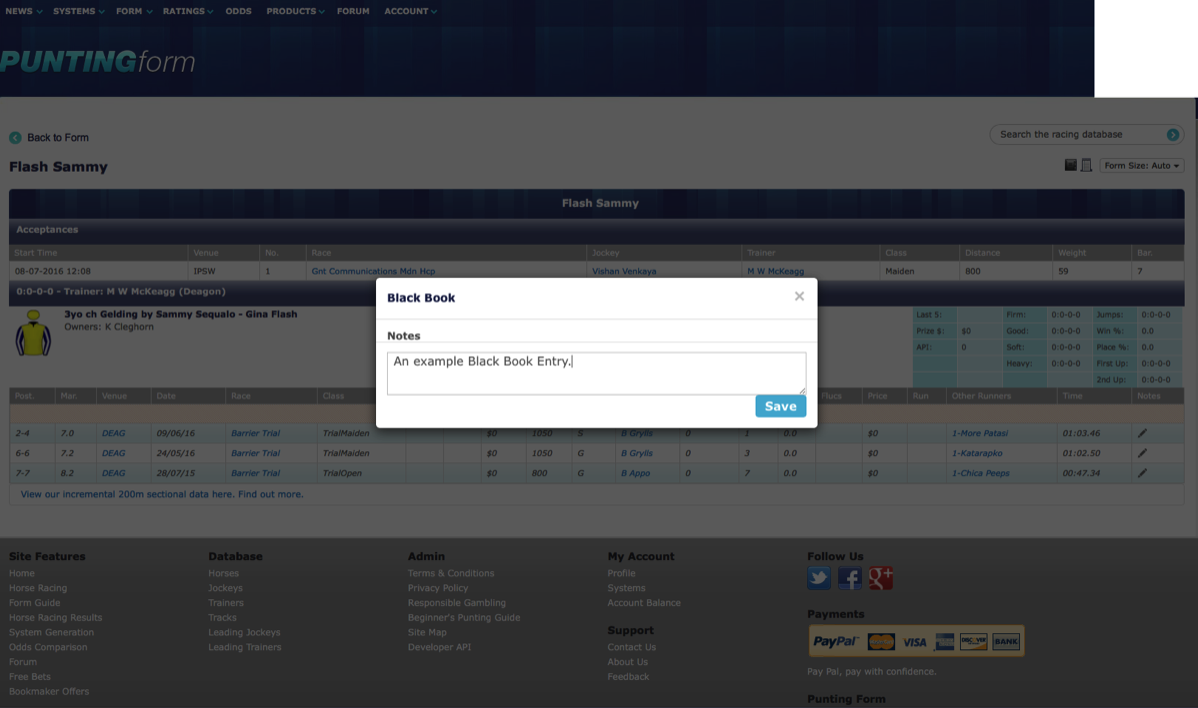
Icon indicating a 'Horse Note' is shown.
Icon indicating a 'Black Book entry' is also shown.
Icon indicating a 'Horse Note' is shown.
Icon indicating a 'Black Book entry' is also shown.


The Meeting Details Page View:
Note: the example shown is for an un-resulted meeting (resulted meetings display in a similar manner with Race Notes and/or Run Notes being able to be edited or created).
Note: the example shown is for an un-resulted meeting (resulted meetings display in a similar manner with Race Notes and/or Run Notes being able to be edited or created).
'User' Bet Sheet Dashboard:


The BetSheet Dashboard can be accessed from the main 'Form' menu followed by Quick Links / Bet Sheets.
Select a Meeting/Race/Horse from the drop-down controls and enter any betting notes, followed by 'Add'. Bet sheets can be shared publicly or privately, with options to print as a .pdf or export to Excel.
Select a Meeting/Race/Horse from the drop-down controls and enter any betting notes, followed by 'Add'. Bet sheets can be shared publicly or privately, with options to print as a .pdf or export to Excel.
Note: The image shown above can be enlarged and then still further magnified screenshots brought into view using the *slider* controls overlaid on the image.
'User' Black Book:
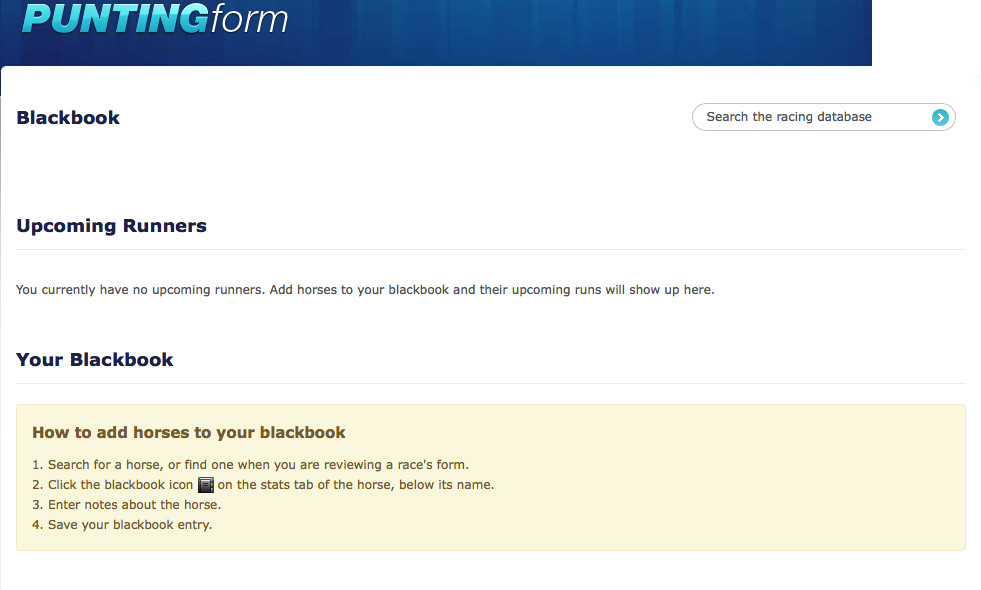

The Black Book area can be accessed from the main 'Form' menu followed by Quick Links / Black Book.
Any previous Black Book entries which have accepted for an upcoming race will be listed first, followed by a complete listing of your Black Book horses to follow.
Any previous Black Book entries which have accepted for an upcoming race will be listed first, followed by a complete listing of your Black Book horses to follow.
Note: The images shown on this page can be enlarged and then still further magnified screenshots brought into view using the *slider* controls overlaid on the image.

How to add horses to your blackbook:
Search for a horse, or find one when you are reviewing a race's form.
Click the blackbook icon … as shown
Enter notes about the horse … as shown
Save your blackbook entry.
Search for a horse, or find one when you are reviewing a race's form.
Click the blackbook icon … as shown
Enter notes about the horse … as shown
Save your blackbook entry.
Developer API (Pro Punter Form specific):
Our developer API is available to all Pro Punter form Members. Please contact us to get your unique API access key.
Data from our API is for personal use only. We can also expose various parts of our framework upon request; if you are after some data that is available on Punting Form but not listed here, let us know and if it makes sense we will release the API.
Please note that you would generally need to have a relational database software package such as Microsoft Access (or similar), if you wish to maintain a personal desktop database of Horse form and results etc. A typical flat-file format for use in Excel etc would be too large and unwieldily as a permanent storage solution. Our existing API's (which can be used to systematically add new data to a preconfigured historical database) are of most use to programmers or those with experience in the use of relational database products.
However, the API's listed as returning standard text file format, may be saved to a .csv file (which can then be opened using Excel or Notepad) by following a simple procedure:
- Paste the API URL (complete with your unique User Key) into your chosen browser address bar.
- Convert the web page of text output to a spreadsheet or csv file by:
- Select (highlight) all text on the web page
- Copy to cell A1 on an Excel spreadsheet (leave column A highlighted)
- On the Excel menu tab, select ‘Data’ then ‘Text To Columns’
- Click Next
- Tick Comma
- Click Next
- Click Finish
- All the data should then be neatly arranged in separate columns.
MQG Web Ratings Feature Set:
Note: please refer to the Pro Punter Form product page for details of; Form Display - Filters & Options, Form Links and Interactive Form - User Notes/Black Book/Bet Sheets (which are also common to MQG Web Ratings).
Ratings Dashboard:


The Ratings Dashboard is accessed from the main 'Ratings' Menu followed by 'View All Available Ratings'.
Clicking the 'View' link on the right hand side displays a .pdf for the chosen meeting (in a new window).
Clicking the 'View' link on the right hand side displays a .pdf for the chosen meeting (in a new window).
Note: The image shown above can be enlarged and then still further magnified screenshots brought into view using the *slider* controls overlaid on the image.
MQG Ratings.pdf :


Our Meeting Quick Guide (MQG) rating sheets (printable .pdf documents) are delivered in an easy to understand format, showing jockey colours and each rating column sorted by rank.
The Top4 runners for each rating category are shown along with run style, predicted settle position and early speed ability for each. A complete meeting summarised in a convenient 2 to 3 page document.
The Top4 runners for each rating category are shown along with run style, predicted settle position and early speed ability for each. A complete meeting summarised in a convenient 2 to 3 page document.
Note: The image shown above can be enlarged and then still further magnified screenshots brought into view using the *slider* controls overlaid on the image.
Notes:
- The ratings are updated at regular intervals on race day to reflect scratchings and track conditions. Please check back on race day, or when track conditions change, to obtain updates.
- The Neural rating is a multi-factor rating. As such, the Neural Price will be more reflective of an actual ‘market’ price and chances of winning (than other single-factor ratings).
- Other rated prices shown, are based on a single-factor rating and as such, should only be used as a guide to the ‘strength of the rating rank’. E.g. a $2.10 Top Ranked Race Time runner, is a much stronger Top Ranking than a $5.00 Top Ranked Race Time runner etc.
- The ESettle Position is based on ‘historical’ run-style. This can be compared to the ESpeed Ranking to determine if a runner has the early speed ability to match its ‘desired’ position in running.
Field For Upcoming Race - Rating View:


'Rating View' encompasses the full suite of our Rating Rank and Rating Assessed Probability data.
The table can be sorted by any of the columns which contain 'sort-by' arrows in the header. 'Mouse hover' does reveal pop-up descriptions and more detailed descriptions are shown below.
The table can be sorted by any of the columns which contain 'sort-by' arrows in the header. 'Mouse hover' does reveal pop-up descriptions and more detailed descriptions are shown below.
Note: The image shown above can be enlarged and then still further magnified screenshots brought into view, using the *slider* controls overlaid on the image.
| Column Heading | Description |
| PFCls | The Punting form Class Change, indicates traditional ‘weight-style’ class movement . A –ve value indicates a class drop compared to the previous start. |
| PFScr | Short for PFScore. This encompasses four rating types and takes the form of a 'consensus score' from 0 to 100. How each runner has 'ranked' in each of the four rating categories (or three where there is no sectional rating available) contributes to the final consensus score. The four rating types used are; Neural, Overall Time, Sectional (L600) Time and Weight (or Class) ratings. |
| NR | The Neural Rating Rank - is essentially a rating based on a broad spread of statistical factors. Achievements are measured relative to the horse population as a whole (and sometimes market expectations), rather than being specifically based on individual performance. Twenty factors are used within the calculation and this rating rank is likely to be the most closely aligned with market expectations for an upcoming race. |
| NPr | The Neural Rated Price - when looked at over a very large sample, will generally have a strike rate which is in line with the winning probability associated with that price. |
| PrSe | The predicted settle position is where we are predicting the runner to settle in the upcoming field of horses (based on AHSP – Average Historical Settle Position %). |
| AHSP | Average Historical Settle Position % (0-100). |
| R/S | The run style indicator categorises where each runner has typically settled in its past performances. Our research has shown that regardless of early speed ability a horse will try and take up its 'usual' position in running. Early speed ability is the factor which will determine how easily it is likely to be able to attain this position and how much energy it will have available to finish the race off. |
| ETR | Early Time Rating Rank - each runner is rated purely using their To 600m sectional time. All other comments relating the overall race time and L600 sectional time rating apply to the early time rating. |
| L6R | Sectional Time Rating Rank - each runner is rated purely using their last 600m sectional time. All other comments relating the overall race time rating apply to the sectional time rating. The unique aspect of this rating is that we have individual sectional times (spanning several years) on which to base the rating, available for all runners, across most metropolitan, provincial and country race meetings conducted throughout Australia, Hong Kong and Singapore. |
| TR | Time Rating Rank - each runner is rated purely using their overall race time. The rating is a performance measure which compares the race time against a benchmark or Par time for the track and distance. Each rating contains adjustments for par time 'strength', potential weight for age improvement, race pace, weight carried and prevailing track conditions. These adjustments are made so we can compare 'apples with apples', regardless of when, where, or how races have been run. This type of rating does not have any race Class considerations. |
| EPr | The To600m Early Time Rating Price. |
| L6Pr | L600 Sectional Time Rating Price. |
| TPr | Time Rating (start to finish) Price. |
| WR | Traditional Weight (or Class) Rating Rank. Every class of race is given a numerical value (in kg) and runner ratings are determined by taking the assigned Class value for the race; adding the WOL (weight over limit) amount and subtracting a beaten margin adjustment. The beaten margin adjustment involves converting the amount a horse has been beaten in lengths; to an equivalent weight value (in kilograms). This type of rating has the benefit of not being influenced by race pace; time or track conditions etc. |
| WTR | Time adjusted Weight Rating Rank. |
| WPr | Traditional Weight or Class Rating Price. |
| WTPr | Time Adjusted Weight or Class Rating Price. |
Developer API (MQG Web Ratings Specific):
Our developer API is available to all MQG Web Ratings Members. The Pro Punter Form 'foundation' API's also form part of those available to MQG Web Rating members and details can be accessed via the 'Pro Punter foundation API' button below. The GetRatingsText API is specific to MQG WebRating members and is also described below. Please contact us to get your unique API access key.
Data from our API is for personal use only. We can also expose various parts of our framework upon request; if you are after some data that is available on Punting Form but not listed here, let us know and if it makes sense we will release the API.
Please note that you would generally need to have a relational database software package such as Microsoft Access (or similar), if you wish to maintain a personal desktop database of Horse form and results etc. A typical flat-file format for use in Excel etc would be too large and unwieldily as a permanent storage solution. Our existing API's (which can be used to systematically add new data to a preconfigured historical database) are of most use to programmers or those with experience in the use of relational database products.
However, the API's listed as returning standard text file format, may be saved to a .csv file (which can then be opened using Excel or Notepad) by following a simple procedure:
- Paste the API URL (complete with your unique User Key) into your chosen browser address bar.
- Convert the web page of text output to a spreadsheet or csv file by:
- Select (highlight) all text on the web page
- Copy to cell A1 on an Excel spreadsheet (leave column A highlighted)
- On the Excel menu tab, select ‘Data’ then ‘Text To Columns’
- Click Next
- Tick Comma
- Click Next
- Click Finish
- All the data should then be neatly arranged in separate columns.
GetRatingsText API
| URL Format: | http://www. puntingform.com.au /api/ratingsservice /getratingstext /sunshine%20coast /06-mar- 2016? apikey= xxxxxxxx-xxxx-xxxx -xxxx-xxxxxxxxxxxx |
|---|---|
| Notes: | Output as CSV. This API requires a subscription to our MQG Web Ratings service. The track name (note the use of %20 to indicate a space) and date are altered to suit the meeting details you wish to return. |
| Column Heading | Description |
| Meeting | Track Name. |
| RaceNo | Race Number. |
| Track Cond | Track Condition Description (Fast, Good, Dead, Slow, Heavy). |
| Horse Name | Horse Name (TAB Number = 0 is assigned Horse Name = "_Race Leader"). |
| TabNo | TAB Number (TAB Number = 0 is assigned to the race leader at the various points of call). |
| Barrier | Barrier Position at Start. |
| Reliable | "True" = amount of Form considered sufficient; "False" = insufficient Form. |
| ClsDiff | The Punting form Class Change indicator indicates traditional ‘weight-style’ class movement . A –ve value indicates a class drop compared to the previous start. |
| RunStyle | The run style indicator categorises where each runner has typically settled in its past performances. Our research has shown that regardless of early speed ability a horse will try and take up its 'usual' position in running. Early speed ability is the factor which will determine how easily it is likely to be able to attain this position and how much energy it will have available to finish the race off. |
| PrSe | The predicted settle position is where we are predicting the runner to settle in the upcoming field of horses (based on AHSP – Average Historical Settle Position %). |
| PFScore | This encompasses each of the previous four ratings methodologies and takes the form of a 'consensus score' from 0 to 100. How each runner has 'ranked' in each of the four ratings categories (or three where there is no sectional rating available) contributes to the final consensus score. |
| AHSP | Average Historical Settle Position % (0-100). |
| RPP | Neural Rating Price. This is essentially a rating based on a broad spread of statistical factors. Achievements are measured relative to the horse population as a whole (and sometimes market expectations) rather than being specifically based on individual performance. Twenty factors are used within the calculation and this rating is likely to be the most closely aligned with market expectations for an upcoming race. |
| RPR | Neaural Rating Rank. |
| RSFI | Race Sectional Form Index. A measure of the amount of sectional form on file for the race (0-100). |
| ScRank | L600 Sectional Time Rating Rank. Each runner is rated purely using their last 600m sectional time. The unique aspect of this rating is that we have individual sectional times (spanning several years) on which to base the rating; available for all runners across most metropolitan and provincial race meetings conducted throughout Australia (we use digital timing off race videos to obtain these ourselves). |
| SPrice | L600 Sectional Time Rating Price. |
| TP20P | Time Rating Price. Each runner is rated purely using their overall race time. The rating is a performance measure which compares the race time against a benchmark or Par time for the track and distance. Each rating contains adjustments for par time 'strength'; potential weight for age improvement; race pace; weight carried and prevailing track conditions. These adjustments are made so we can compare 'apples with apples'; regardless of when; where; or how races have been run. This type of rating does not have any race Class considerations. |
| TP20R | Time Rating Rank. |
| WP20P | Weight Rating Price. Every class of race is given a numerical value (in kg) and runner ratings are determined by taking the assigned Class value for the race; adding the WOL (weight over limit) amount and subtracting a beaten margin adjustment. The beaten margin adjustment involves converting the amount a horse has been beaten in lengths; to an equivalent weight value (in kilograms). This type of rating has the benefit of not being influenced by race pace; time or track conditions etc. |
| WP20R | Weight rating Rank. |
| WPTP20P | Time adjusted Weight Rating Price. |
| WPTP20R | Time adjusted Weight Rating Rank. |
| PdfPath | Name of rating Meeting Quick Guide document. |
| Publish Time | Time of Meeting Quick Guide document update. |
| EPr | The To600m Early Time Rating Price. |
| ETR | The To600m Early Time Rating Rank. |
Desktop Ratings Feature Set:
Note: please refer to the Pro Punter Form and MQG Web Ratings product pages for details of; Form Display - Filters & Options, Form Links and Interactive Form - User Notes/Black Book/Bet Sheets, MQG Rating .pdf and 'Rating View' tables for upcoming race fields. (which are also common to our Desktop Ratings).
Main Window:


For those wishing to dig deeper into the Ratings Suite than what our web based, ‘at-a-glance’ Meeting Quick Guides can cater for, we have a Desktop Ratings and Analysis software package available. This is a highly detailed package suitable for ‘form students’ who like to look at each individual past-run and understand how it contributes to the overall picture.
Access to MQG documents and 'Rating View' tables in our form guides for upcoming races is included.
Access to MQG documents and 'Rating View' tables in our form guides for upcoming races is included.
Note: The image shown above can be enlarged and then still further magnified screenshots brought into view using the *slider* controls overlaid on the image.
Reviewer Panel:
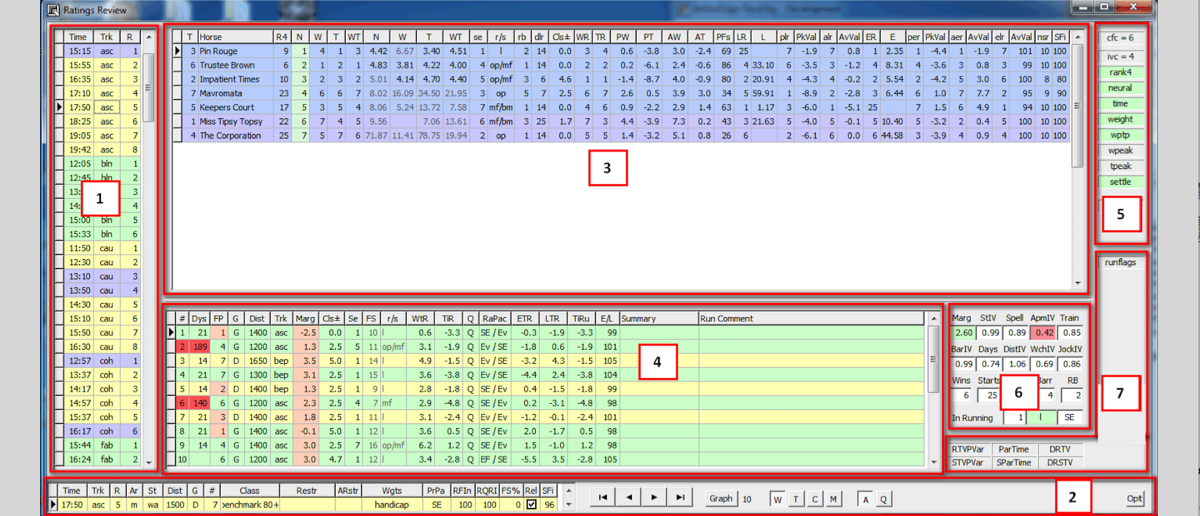
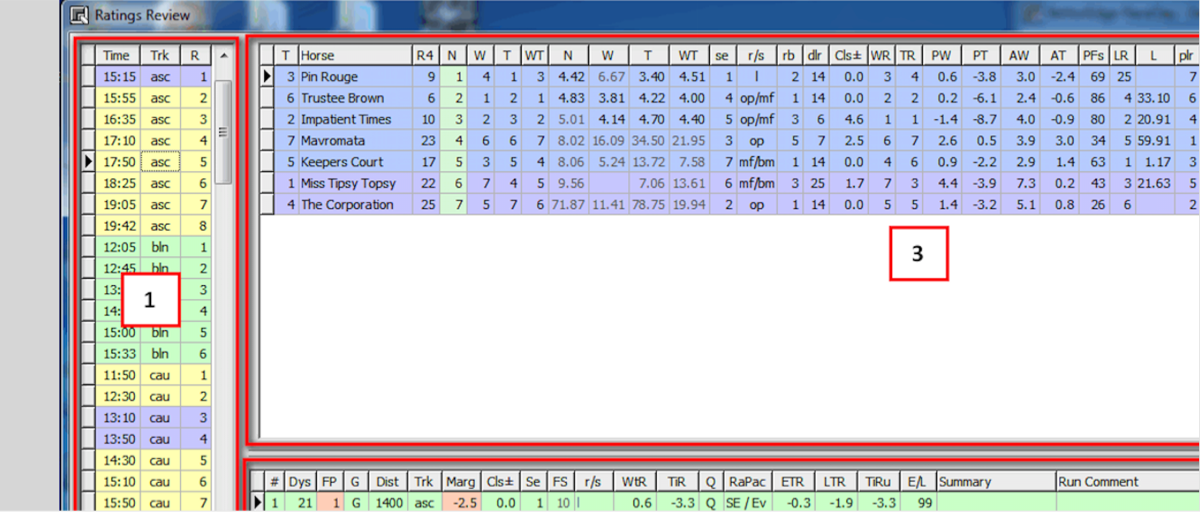


Due to the detailed nature of this package (the reviewer panel specifically), a ‘one on one’ set-up and training session is offered with your first subscription. 'Numbered' areas on the screenshot are fully detailed in the tables below:
Note: The image shown above can be enlarged and then still further magnified screenshots brought into view using the *slider* controls overlaid on the image.
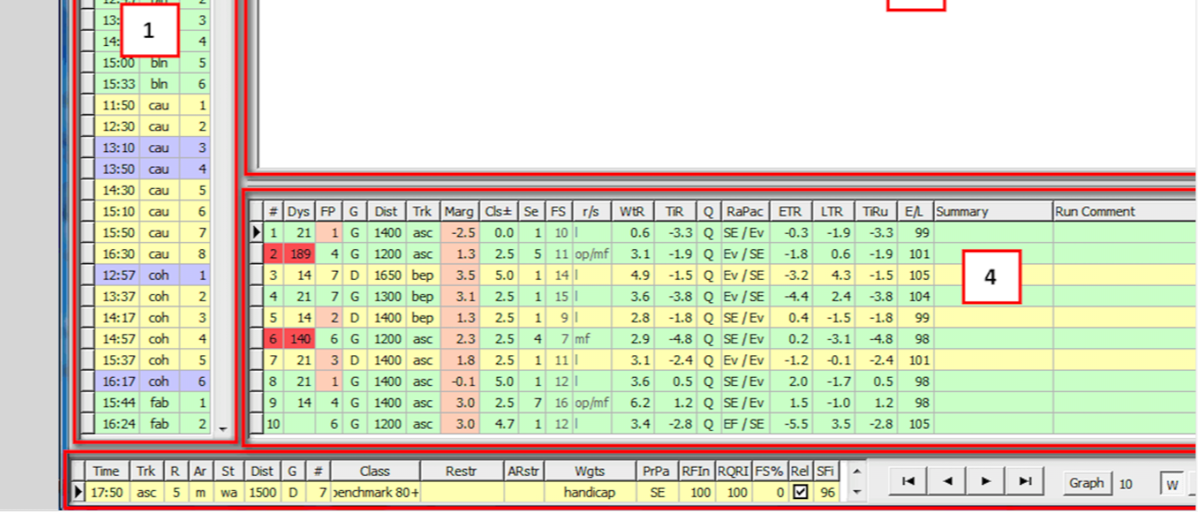
1. Race Navigation pane:
| Column Header | Description |
| Time | Race time (can be adjusted for user location). |
| Trk | Three letter track code. |
| R | Race number. |
2. Race Details pane:
| Column Header | Description |
| Ar | Metropolitan, provincial, country. |
| St | State. |
| Dist | Race distance. |
| G | Going (track condition). |
| # | Field size. |
| Class | Race class. |
| Restr | General race restrictions. |
| ARstr | Age based race restrictions. |
| Wgts | Weight based race conditions. |
| PrPa | Predicted race pace. |
| RFIn | Race form index (100 indicates maximum amount of past form runs available for race). |
| RQRI | Race qualified run form index (100 indicates the max amount of relevant form is available). |
| FS% | Percentage of first starters in race. |
| Rel | A reliable amount of race form ‘yes/no’ indicator. |
| SFi | The race sectional form index (100 shows max amount of sectional time form avail for race). |
| < | Race navigation controls: first race, back one, forward one, last race. |
| Graph | Click to produce speed and sectional race maps, and individual run rating charts. |
| W | Display relative ‘class/weight’ rating on individual run rating charts. |
| T | Display relative ‘time’ rating on individual run rating charts. |
| C | Display relative ‘race class’ on individual charts. |
| M | Display ‘beaten margin’ on individual charts. |
| A | Display all form runs on individual charts. |
| Q | Display only ‘qualified’ or relevant runs on individual charts. |
3. Race Field Details pane:
| Column Header | Description |
| T | TAB number. |
| Horse | Horse name. |
| R4 | Rank 4 rating (consensus score which sums the rank values of N, W, T, and WT ratings). |
| N | Neural ranking and rated price. |
| W | Weight (class) ranking and rated price. |
| T | Overall race time ranking and rated price. |
| WT | Combined weight and time ranking and rated price. |
| se | Predicted early settle position. |
| r/s | Indication of historical running style. |
| rb | Runs back from spell. |
| dlr | Days since last run. |
| Cls+- | Class change from last start (-ve indicates dropping in class this start) . |
| WR | Peak weight rating rank (from last 5 starts). |
| TR | Peak time rating rank (from last 5 starts). |
| PW | Peak relative weight rating from last 5 starts (-ve indicates a better or stronger perf value). |
| PT | Peak relative time rating from last 5 starts (-ve indicates a better or stronger perf value). |
| AW | Ave relative weight rating from last 5 starts (-ve indicates a better or stronger perf value). |
| AT | Average relative time rating from last 5 starts (-ve indicates a better or stronger perf value). |
| PFs | Punting form score (a max 100 consensus rating incorporating N, W, T and Sectional). |
| LR | Late sectional time rating rank (considers individual last 600 sectional time). |
| L | Late sectional time rated price. |
| plr | Peak late sectional ranking. |
| PkVal | Peak relative late sectional time rating (-ve indicates a better or stronger perf value). |
| alr | Average late sectional ranking. |
| AvVal | Average relative late sectional time rating (-ve indicates a better or stronger perf value). |
| ER | Early sectional time rating rank (considers individual start-to-600 sectional time). |
| E | Early sectional time rated price. |
| per | Peak early sectional ranking. |
| PkVal | Peak relative early sectional time rating (-ve indicates a better or stronger perf value). |
| aer | Average early sectional ranking. |
| AvVal | Average relative early sectional time rating (-ve indicates a better or stronger perf value). |
| elr | Average early to late ratio ranking. |
| AvVal | Average early to late ratio value (lower numbers indicate higher late speed relative to early speed). |
| nsr | Number of past form runs with an available sectional time rating. |
| SFi | Runner sectional form index (e.g. an nsr = 2, from 2 career starts will equal 100). |
4. Runner Form Details pane:
| Column Header | Description |
| # | Runs ago number |
| Days | Days since previous run. |
| FP | Finish position. |
| G | Going. |
| Dist | Race distance. |
| Trk | Three letter track code. |
| Marg | Beaten margin in lengths (-ve indicates winning margin). |
| Cls+- | Class change value, relative to todays race (-ve indicates a stronger race class than todays). |
| Se | Early settle position. |
| FS | Field size. |
| r/s | Running style adopted for that run. |
| WtR | Relative weight rating advantage (in lengths) to that typically required to win todays class of race (-ve indicates a better or stronger perf value). |
| TiR | Relative pace-adjusted time rating advantage (in lengths) to that typically required to win todays class of race (-ve indicates a better or stronger perf value). These are the values used to assess rank and price based on Time (as opposed to TiRu described below). |
| Q | Qualified or relevant run indicator. |
| RaPac | Race pace shown for two segments, early pace / late pace. |
| ETR | Relative early sectional time rating advantage (in lengths) to that typically required to win todays class of race (-ve indicates a better or stronger perf value). |
| LTR | Relative late sectional time rating advantage (in lengths) to that typically required to win todays class of race (-ve indicates a better or stronger perf value). |
| TiRu | Relative unadjusted (raw value, no pace-adjustment) time rating advantage (in lengths) to that typically required to win todays class of race (-ve indicates a better or stronger perf value). |
| E/L | Early to late ratio value (lower numbers indicate higher late speed relative to early speed). |
| Summary | Future provision for a run comment summary (not activated at present). |
| Run Comment | Future provision for a detailed run comment (not activated at present). |
5. Positive / Negative Form Attribute pane:
| Column Header | Description |
| Green background | Positive indication for that form attribute. |
| Red background | Negative indication for that form attribute. |
6. Impact Value and Positive / Negative Form Attribute pane:
| Column Header | Description |
| IV / a2e | 1.00 means performing to ‘expectations’ (less than 1.00 is perf below expectations etc) |
| Green background | Positive indication for that form attribute. |
| Red background | Negative indication for that form attribute. |
| Marg | Beaten margin impact value, a measure of beaten margin relative to the winner over a sequence of previous starts. |
| StIV | Total career starts impact value. |
| Spell | Runs back from spell impact value. |
| ApmIV | Average prize money ratio impact value – is based on the individual runners average prizemoney per start, expressed as a ratio of the average prizemoney per start considering the whole race field. |
| Train | Trainer a2e |
| BarIV | Barrier impact value. |
| Days | Days since last run impact value, is based on days since last run over a sequence of starts relative to the distance of race contested at each of the previous starts relative to the distance of race contested at each of the previous starts. |
| DistIV | Distance change impact value, is based on distance change relative to the distance of today’s race over a sequence of previous starts. |
| WchIV | Weight change impact value – is based on weight change over a sequence of previous starts. |
| JockIV | Jockey a2e. |
| Wins | Career wins. |
| Starts | Career starts. |
| Barr | Barrier position. |
| RB | Runs back since spell. |
| In Running | Predicted settle position, past run style, predicted race pace. |
7. Run Flags pane:
| Column Header | Description |
| Admin | An admin panel indicating the source of ‘suspect’ rating values / run flags. |
Graphical Functions:


After clicking the 'Graph' button:
1st pane: pred settle pos / speed map.
2nd pane: peak sectional rating map.
3rd pane: average sectional rating map.
1st pane: pred settle pos / speed map.
2nd pane: peak sectional rating map.
3rd pane: average sectional rating map.
Note: The images shown on this page can be enlarged and then still further magnified screenshots brought into view using the *slider* controls overlaid on the image.

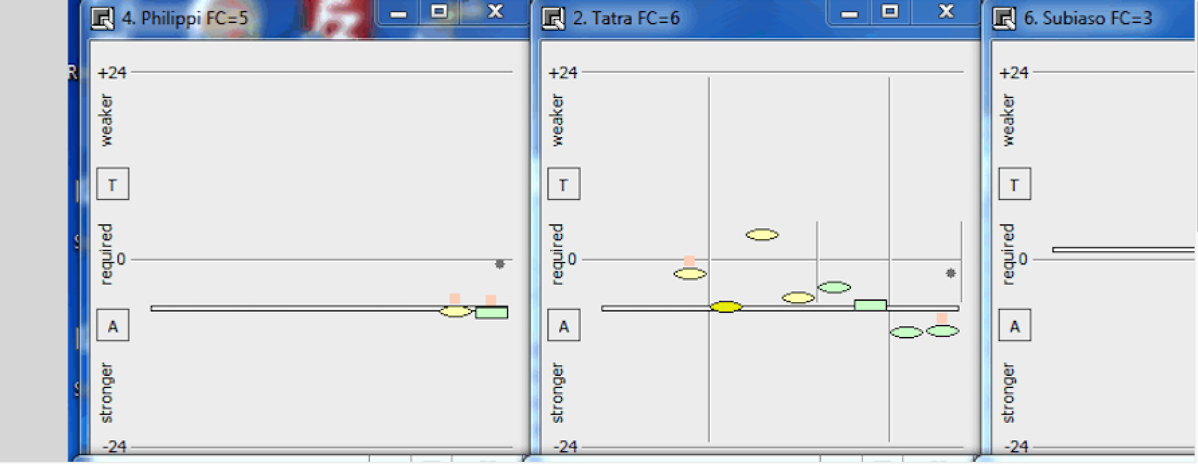
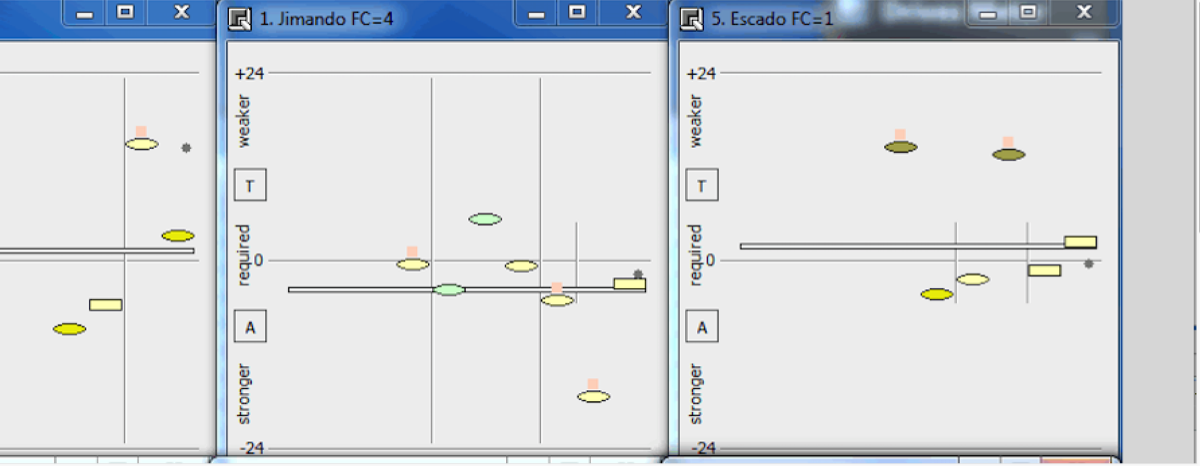
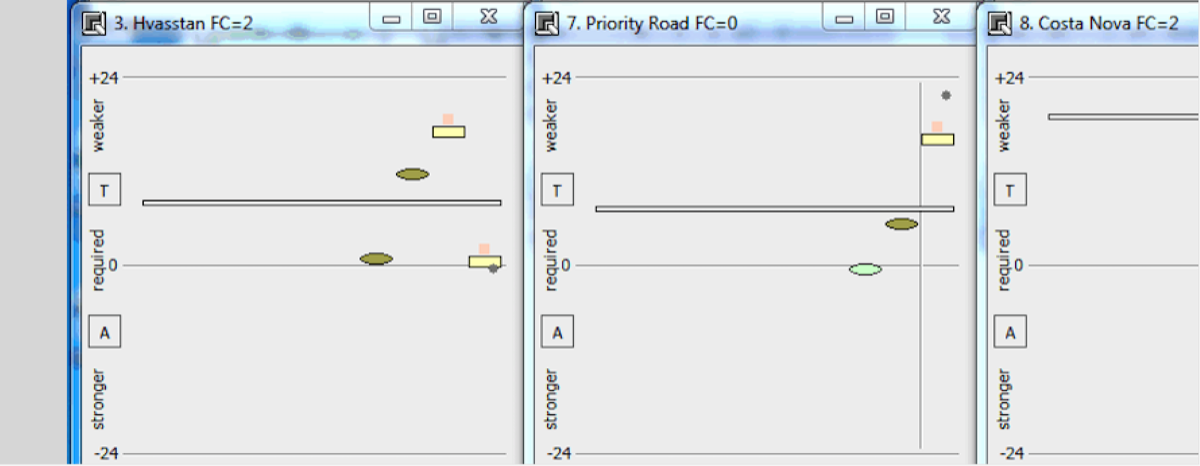

Relative run rating charts with the zero or ‘required’ line indicating the rating performance required to win todays race class. Below the line indicates a stronger perf than that req today. The horizontal bar represents the runners ave run rating and marker colour coding represents track condition.
Ratings & Form Stats Analyser:


This software accompanies the RaceDay application and can be used to analyse historical rating and form data over an extensive period of time and races (data from 1/03/2013 onwards is supplied). Some users find it useful to identify ‘strong’ form criteria for use in manual form-study, while others develop and save stand-alone ‘system’ style filter sets to pinpoint (list) runners which meet the exact filter criteria on race day.
Note: The images shown on this page can be enlarged and then still further magnified screenshots brought into view using the *slider* controls overlaid on the image.


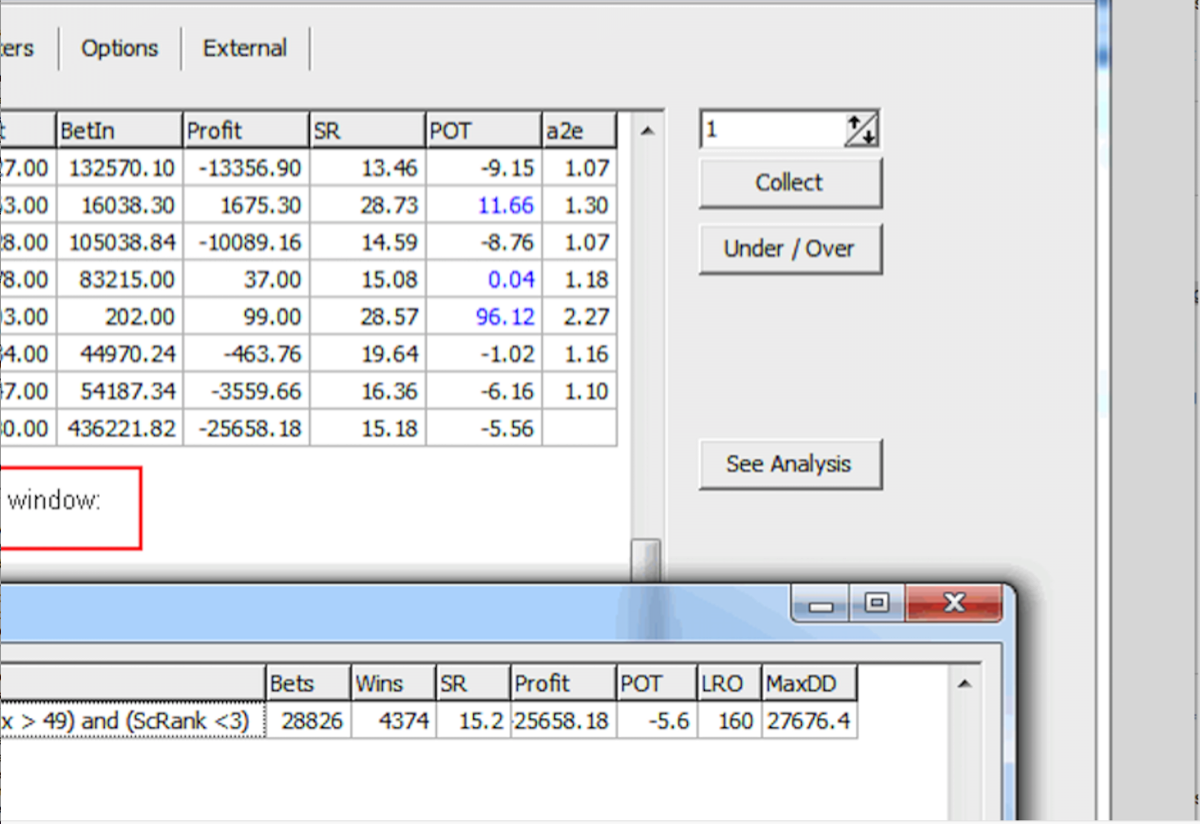

The filter string shown in the example above tests the entire database for runners which meet the criteria; (fast, good or dead going and race sectional form index greater than 49 and sectional time rating rank less than 3)……with filter results further sorted and displayed by ‘run style’, as shown.
Developer API (Desktop Ratings Specific):
Our developer API is available to all Desktop Ratings Members. The Pro Punter Form 'foundation' API's also form part of those available to Desktop Rating members and details can be accessed via the 'Pro Punter foundation API' button below. The GetSouthcoastData API (includes PF Rating Data) is specific to Desktop Rating members and is also described below. Please contact us to get your unique API access key.
Data from our API is for personal use only. We can also expose various parts of our framework upon request; if you are after some data that is available on Punting Form but not listed here, let us know and if it makes sense we will release the API.
Please note that you would generally need to have a relational database software package such as Microsoft Access (or similar), if you wish to maintain a personal desktop database of Horse form and results etc. A typical flat-file format for use in Excel etc would be too large and unwieldily as a permanent storage solution. Our existing API's (which can be used to systematically add new data to a preconfigured historical database) are of most use to programmers or those with experience in the use of relational database products.
However, the API's listed as returning standard text file format, may be saved to a .csv file (which can then be opened using Excel or Notepad) by following a simple procedure:
- Paste the API URL (complete with your unique User Key) into your chosen browser address bar.
- Convert the web page of text output to a spreadsheet or csv file by:
- Select (highlight) all text on the web page
- Copy to cell A1 on an Excel spreadsheet (leave column A highlighted)
- On the Excel menu tab, select ‘Data’ then ‘Text To Columns’
- Click Next
- Tick Comma
- Click Next
- Click Finish
- All the data should then be neatly arranged in separate columns.
GetSouthcoastData API (includes PF Rating Data):
| 'true' URL Format: | http://www. puntingform.com.au /api/ratingsservice /getsouthcoastdata /standard/true/all? apikey= xxxxxxxx- xxxx-xxxx -xxxx-xxxxxxxxxxxx |
|---|---|
| 'false' URL Format: | http://www. puntingform.com.au /api/ratingsservice /getsouthcoastdata /standard/false/all? apikey= xxxxxxxx- xxxx-xxxx -xxxx-xxxxxxxxxxxx |
| Notes: | Output as CSV. Requires a subscription to our Desktop Ratings. The 'true' option is cached and returns 2 weeks of historical ratings+dividend data plus the ratings data for upcoming meetings at the time of caching. The 'false' option returns ratings data for upcoming meetings at the time the url call is made (is not cached). The State designator 'all' can be replaced by Qld, Vic, NSW etc. |
| Column Heading | Description |
| Race_Date | Meeting Date. |
| Track_Code | Track Code. |
| Track_Name | Track Name. |
| Race_Number | Race Number. |
| Horse_Name | Horse Name. |
| TP20R | Time Rating Rank - each runner is rated purely using their overall race time. The rating is a performance measure which compares the race time against a benchmark or Par time for the track and distance. Each rating contains adjustments for par time 'strength', potential weight for age improvement, race pace, weight carried and prevailing track conditions. These adjustments are made so we can compare 'apples with apples', regardless of when, where, or how races have been run. This type of rating does not have any race Class considerations. |
| TP20P | Time Rating Price. |
| PFScore | Multi Rating 'consensus score' from 0 to 100. |
| NSWPr | NSW Tote Price. |
| VICPr | Vic Tote Price. |
| PrSe | Predicted Settle Position based on historical settle position. |
| RunStyle | Run Style Category based on historical settle position. |
| AHSP | Average Historical Settle Position % - lower figure for Leaders. |
| ETRPrRk | Early Time Rating Rank - each runner is rated purely using their To 600m sectional time. All other comments relating the overall race time rating (above) and L600 sectional time rating apply to the early time rating. |
| ETRPrice | Early Time Rating Price. |
| RPR | The Neural Rating Rank - is essentially a rating based on a broad spread of statistical factors. Achievements are measured relative to the horse population as a whole (and sometimes market expectations), rather than being specifically based on individual performance. Twenty factors are used within the calculation and this rating rank is likely to be the most closely aligned with market expectations for an upcoming race. |
| RPP | The Neural Rated Price - when looked at over a very large sample, will generally have a strike rate which is in line with the winning probability associated with that price. |
| WP20R | Traditional Weight or Class Rating Rank. |
| WP20P | Traditional Weight or Class Rating Price. |
| WPTP20R | Time Adjusted Weight or Class Rating Rank. |
| WPTP20P | Time Adjusted Weight or Class Rating Price. |
| ClsDiff | Class Change indicator shows traditional ‘weight-style’ class movement . A –ve value indicates a class drop compared to the previous start. |
| ATWC | Actual Traditional Weight Class figure. |
| AveATWC | Ave Track Traditional Weight Class figure. |
| ScRank | Sectional Time Rating Rank - each runner is rated purely using their last 600m sectional time. All other comments relating the overall race time rating (above) apply to the sectional time rating. The unique aspect of this rating is that we have individual sectional times (spanning several years) on which to base the rating, available for all runners, across most metropolitan, provincial and country race meetings conducted throughout Australia. |
| SPrice | Sectional Time Rating Price. |
| TabNo | TAB Number. |
Sectional Pro Form Feature Set:
Note: please refer to the Pro Punter Form and MQG Web Ratings product pages for details of; Form Display - Filters & Options, Form Links and Interactive Form - User Notes/Black Book/Bet Sheets and MQG Rating documents (which are also common to Sectional Pro Form).
Field for Upcoming Race - Standard View:


This is accessed by sel a meeting and then race, from the 'Form' menu. There are 3 'radio' buttons which determine what columns are displayed; 'Std View', 'Rating View' and 'Key Data View'.
'Std View' shows std form data and the Odds Comparison table. It is also visible with a Pro Punter Form sub (the PF score rating requires a MQG Rating sub).
'Std View' shows std form data and the Odds Comparison table. It is also visible with a Pro Punter Form sub (the PF score rating requires a MQG Rating sub).
Note: The image shown above can be enlarged and then still further magnified screenshots brought into view, using the *slider* controls overlaid on the image.
| Column Heading | Description |
| PF | Short for PFScore. This encompasses four rating types and takes the form of a 'consensus score' from 0 to 100. How each runner has 'ranked' in each of the four rating categories (or three where there is no sectional rating available) contributes to the final consensus score. The four rating types used are; Neural, Overall Time, Sectional (L600) Time and Weight (or Class) ratings. |
| API | Average Prize Money Index (,000). Equals total career prize money divided by the total career starts. i.e. $,000/Start |
| PP | Pre Post Price. A 'newspaper' style indicative pre post price. |
Field for Upcoming Race - Rating View:
'Rating View' encompasses the full suite of our Rating Rank and Rating Assessed Probability data.
The table can be sorted by any of the columns which contain 'sort-by' arrows in the header. 'Mouse hover' does reveal pop-up descriptions, but detailed descriptions are shown below as well. This view is also visible with a MQG Web Ratings subscription.
The table can be sorted by any of the columns which contain 'sort-by' arrows in the header. 'Mouse hover' does reveal pop-up descriptions, but detailed descriptions are shown below as well. This view is also visible with a MQG Web Ratings subscription.
Note: The image shown above can be enlarged and then still further magnified screenshots brought into view, using the *slider* controls overlaid on the image.
| Column Heading | Description |
| PFCls | The Punting form Class Change, indicates traditional ‘weight-style’ class movement . A –ve value indicates a class drop compared to the previous start. |
| PFScr | Short for PFScore. This encompasses four rating types and takes the form of a 'consensus score' from 0 to 100. How each runner has 'ranked' in each of the four rating categories (or three where there is no sectional rating available) contributes to the final consensus score. The four rating types used are; Neural, Overall Time, Sectional (L600) Time and Weight (or Class) ratings. |
| NR | The Neural Rating Rank - is essentially a rating based on a broad spread of statistical factors. Achievements are measured relative to the horse population as a whole (and sometimes market expectations), rather than being specifically based on individual performance. Twenty factors are used within the calculation and this rating rank is likely to be the most closely aligned with market expectations for an upcoming race. |
| NPr | The Neural Rated Price - when looked at over a very large sample, will generally have a strike rate which is in line with the winning probability associated with that price. |
| PrSe | The predicted settle position is where we are predicting the runner to settle in the upcoming field of horses (based on AHSP – Average Historical Settle Position %). |
| AHSP | Average Historical Settle Position % (0-100). |
| R/S | The run style indicator categorises where each runner has typically settled in its past performances. Our research has shown that regardless of early speed ability a horse will try and take up its 'usual' position in running. Early speed ability is the factor which will determine how easily it is likely to be able to attain this position and how much energy it will have available to finish the race off. |
| ETR | Early Time Rating Rank - each runner is rated purely using their To 600m sectional time. All other comments relating the overall race time and L600 sectional time rating apply to the early time rating. |
| L6R | Sectional Time Rating Rank - each runner is rated purely using their last 600m sectional time. All other comments relating the overall race time rating apply to the sectional time rating. The unique aspect of this rating is that we have individual sectional times (spanning several years) on which to base the rating, available for all runners, across most metropolitan, provincial and country race meetings conducted throughout Australia, Hong Kong and Singapore. |
| TR | Time Rating Rank - each runner is rated purely using their overall race time. The rating is a performance measure which compares the race time against a benchmark or Par time for the track and distance. Each rating contains adjustments for par time 'strength', potential weight for age improvement, race pace, weight carried and prevailing track conditions. These adjustments are made so we can compare 'apples with apples', regardless of when, where, or how races have been run. This type of rating does not have any race Class considerations. |
| EPr | The To600m Early Time Rating Price. |
| L6Pr | L600 Sectional Time Rating Price. |
| TPr | Time Rating (start to finish) Price. |
| WR | Traditional Weight (or Class) Rating Rank. Every class of race is given a numerical value (in kg) and runner ratings are determined by taking the assigned Class value for the race; adding the WOL (weight over limit) amount and subtracting a beaten margin adjustment. The beaten margin adjustment involves converting the amount a horse has been beaten in lengths; to an equivalent weight value (in kilograms). This type of rating has the benefit of not being influenced by race pace; time or track conditions etc. |
| WTR | Time adjusted Weight Rating Rank. |
| WPr | Traditional Weight or Class Rating Price. |
| WTPr | Time Adjusted Weight or Class Rating Price. |
Field for Upcoming Race - Key Data View:


Key Data View enables 'key' data about each runner to be compared for up to 10 previous starts. The 'Key' can be changed by choosing a form variable from the drop-down as indicated. Exactly what form variables are available will depend upon your level of subscription. The Pos (position) column shown for each start cannot be changed and shows the finished position against field size.
Note: The image shown above can be enlarged and then still further magnified screenshots brought into view, using the *slider* controls overlaid on the image.
Horse Form for Upcoming Race:


Sectional Time and Bmarking data is shown for each horse, along with the corresponding data for the race leader. Data is shown for the number of past starts specified under the Form Guide 'Options' setting.
The Sectional Time and Bmark data table is only visible with a Sect Pro Form subscription.
The Sectional Time and Bmark data table is only visible with a Sect Pro Form subscription.
Note: The image shown above can be enlarged and then still further magnified screenshots brought into view, using the *slider* controls overlaid on the image.
The benchmarks do reflect prevailing conditions (track & distance, going, wind, etc).
All Bmark Var L is a comparable figure across races (normalized for distance) and is independant of class or location.
-ve Lengths variation from benchmark indicates faster than benchmark.
+ve Lengths variation from benchmark indicates slower than benchmark.
There are three user controls (drop-down menus) embedded in the table:
….listed from left to right
1. 200m Split Rank in Race; 200m Split Time (sec).
The colour coded 'Split Rank' map provides a quick visual reference of the 'relative' energy expenditure for each run (1 to 4 green, 5 to 8 yellow and over 8 is pink). The ability to view how a horse has run each consecutive 200m segment, can provide valuable insight into the way energy has been distributed. There is also an option to view time instead of rank (colour coding is maintained).
2. Sectional Time (sec); Sectional Time Rank in Race; Margin From Leader; Position In Running.
Covers the race segment from various position markers to the finish line. The 'Margin From Leader' and 'Position In Running' options provide valuable information regarding how the race has unfolded. Lengths gained or lost between distance markers and the running of comfortable splits whilst maintaining a position in running, can be key pointers in explaining race outcomes.
3. All Bmark Var L / Leader; Cls Bmark Var L / Leader.
The default benchmark setting (via the drop-down menu) is the 'All Benchmark Variation Lengths' for this horse over the corresponding figure for the race leader. As already mentioned, the figures shown are directly comparable across all track conditions, distances and class of race for this drop-down setting. The three race segments represented by benchmarks include; to the 600m marker, the last 600m and the overall race (start to finish). To see how a runner performed, or how a race was run relative to the race class (as opposed to the more general All Ave Benchmark), the 'Class Benchmark Variation Lengths' option can be selected from the drop-down menu instead.
Horse Career:


'Horse Career' information is displayed by clinking on any of the Horse Name links in our form guide. It has a similar format to the 'horse form' which appears for an upcoming race, but shows all career starts. The Standard Form data (top table) can be accessed with a Pro Punter Form subscription.
The Sect Time and Bmark data table is only visible with a Sect Pro Form subscription.
The Sect Time and Bmark data table is only visible with a Sect Pro Form subscription.
Note: The image shown above can be enlarged and then still further magnified screenshots brought into view, using the *slider* controls overlaid on the image.
Meeting Results:


The 'Meeting Summary' Table shows data for the 'Winner' of each race. The usual dropdown options are available and the Race Leader benchmarks are displayed with each winners benchmarks to reveal the 'race pace'.
The Sect Time and Bmark data table is only visible with a Sect Pro Form subscription.
The Sect Time and Bmark data table is only visible with a Sect Pro Form subscription.
Note: The images shown on this page can be enlarged and then still further magnified screenshots brought into view, using the *slider* controls overlaid on the image.
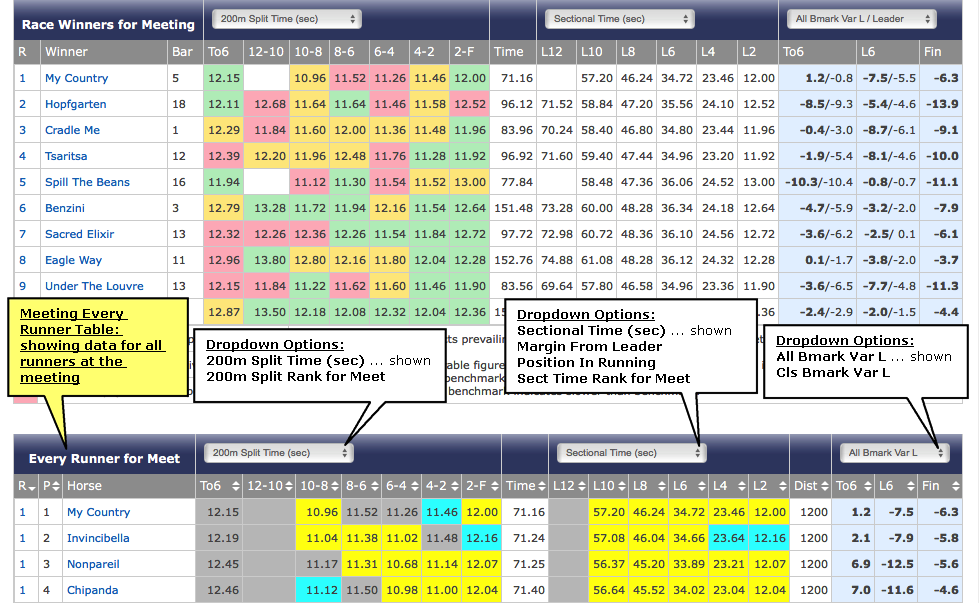


The 'Meeting Every Runner' Table shows data for all the horses which ran at the meeting in question. The usual dropdown options are available and each Race Distance is also shown to enable grouping and sorting by race distance across the meeting.
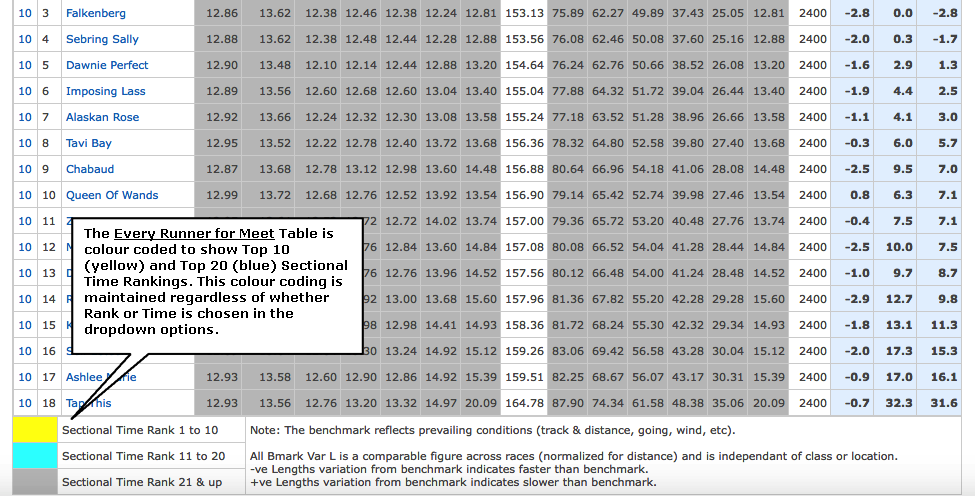

There is colour coding to show the Top 10 (yellow) and Top 20 (blue) Sectional Time Rankings. This can give a quick reference as to which is currently the 'sort-by' column, with the colour coding being maintained regardless of whether Rank or Time (sec) is chosen in the dropdown options.


The Table can be sorted in ascending or descending order by clicking on the 'sort-by' arrows in the relevant column header.


When looking at raw Sect / Split Times (sec), it is of limited value to 'sort' across a meeting comprising a broad range of race distances. For this reason the 'Meeting Every Runner' Table can be made to display rankings 'grouped' by race distance. This is done by using combinations of 'sort-by' sequences. e.g. Sorting the table by 'All Bmark Var L - Fin' followed by a sort-by Distance.
Race Results - Standard View:


The 'Race Results' page is accessed by clicking on a race hyperlink in the 'Meeting Summary' Table. There are two 'radio' buttons which determine what columns are displayed in the Race Results Table; 'Standard View' and 'Key Data View'. 'Standard' view is also included with a Pro Punter Form subscription.
The Sect Time and Bmark data table is only visible with a Sectional Pro Form sub.
The Sect Time and Bmark data table is only visible with a Sectional Pro Form sub.
Note: The image shown above can be enlarged and then still further magnified screenshots brought into view, using the *slider* controls overlaid on the image.
Race Results - Key Data View:


Key Data View enables 'key' data about each runner to be compared for up to 4 previous starts, 'This Start', and up to 5 subsequent starts. The 'Key' can be changed by choosing a form variable from the drop-down. Exactly what form variables are available depends upon your level of subscription. The Pos column shows the finished position against field size and is colour coded for 1st, 2nd and 3rd placings.
Note: The images shown on this page can be enlarged and then still further magnified screenshots brought into view, using the *slider* controls overlaid on the image.

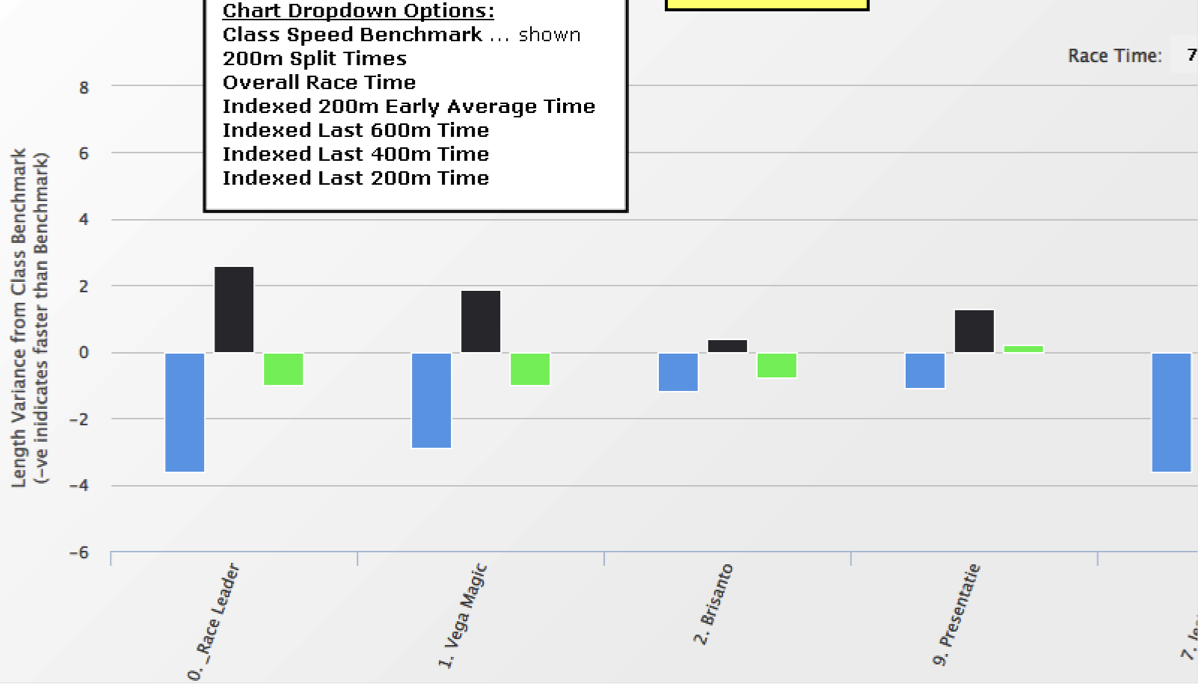


For those who prefer a more 'graphical' presentation, we provide a 'Chart View' in addition to the tabular displays already mentioned above.
The Sect Time and Bmark Charts are only visible with a Sect Pro Form subscription.
The Sect Time and Bmark Charts are only visible with a Sect Pro Form subscription.
Developer API (Sectional Pro Form Specific):
Our developer API is available to all Sectional Pro Form Members. The Pro Punter Form 'foundation' API's also form part of those available to Sectional Pro Form members and details can be accessed via the 'Pro Punter foundation API' button below. The GetSouthcoastData API (includes PF Rating Data), GetBenchmarksMonth API and GetKeyBenchmarks API are specific to Sectional Pro Form members and are also described below. Please contact us to get your unique API access key.
Data from our API is for personal use only. We can also expose various parts of our framework upon request; if you are after some data that is available on Punting Form but not listed here, let us know and if it makes sense we will release the API.
Please note that you would generally need to have a relational database software package such as Microsoft Access (or similar), if you wish to maintain a personal desktop database of Horse form and results etc. A typical flat-file format for use in Excel etc would be too large and unwieldily as a permanent storage solution. Our existing API's (which can be used to systematically add new data to a preconfigured historical database) are of most use to programmers or those with experience in the use of relational database products.
However, the API's listed as returning standard text file format, may be saved to a .csv file (which can then be opened using Excel or Notepad) by following a simple procedure:
- Paste the API URL (complete with your unique User Key) into your chosen browser address bar.
- Convert the web page of text output to a spreadsheet or csv file by:
- Select (highlight) all text on the web page
- Copy to cell A1 on an Excel spreadsheet (leave column A highlighted)
- On the Excel menu tab, select ‘Data’ then ‘Text To Columns’
- Click Next
- Tick Comma
- Click Next
- Click Finish
- All the data should then be neatly arranged in separate columns.
GetSouthcoastData API (includes PF Rating Data):
| 'true' URL Format: | http://www. puntingform.com.au /api/ratingsservice /getsouthcoastdata /standard/true/all? apikey= xxxxxxxx- xxxx-xxxx -xxxx-xxxxxxxxxxxx |
|---|---|
| 'false' URL Format: | http://www. puntingform.com.au /api/ratingsservice /getsouthcoastdata /standard/false/all? apikey= xxxxxxxx- xxxx-xxxx -xxxx-xxxxxxxxxxxx |
| Notes: | Output as CSV. Requires a subscription to Sectional Pro Form. The 'true' option is cached and returns 2 weeks of historical ratings+dividend data plus the ratings data for upcoming meetings at the time of caching. The 'false' option returns ratings data for upcoming meetings at the time the url call is made (is not cached). The State designator 'all' can be replaced by Qld, Vic, NSW etc. |
| Column Heading | Description |
| Race_Date | Meeting Date. |
| Track_Code | Track Code. |
| Track_Name | Track Name. |
| Race_Number | Race Number. |
| Horse_Name | Horse Name. |
| TP20R | Time Rating Rank - each runner is rated purely using their overall race time. The rating is a performance measure which compares the race time against a benchmark or Par time for the track and distance. Each rating contains adjustments for par time 'strength', potential weight for age improvement, race pace, weight carried and prevailing track conditions. These adjustments are made so we can compare 'apples with apples', regardless of when, where, or how races have been run. This type of rating does not have any race Class considerations. |
| TP20P | Time Rating Price. |
| PFScore | Multi Rating 'consensus score' from 0 to 100. |
| NSWPr | NSW Tote Price. |
| VICPr | Vic Tote Price. |
| PrSe | Predicted Settle Position based on historical settle position. |
| RunStyle | Run Style Category based on historical settle position. |
| AHSP | Average Historical Settle Position % - lower figure for Leaders. |
| ETRPrRk | Early Time Rating Rank - each runner is rated purely using their To 600m sectional time. All other comments relating the overall race time rating (above) and L600 sectional time rating apply to the early time rating. |
| ETRPrice | Early Time Rating Price. |
| RPR | The Neural Rating Rank - is essentially a rating based on a broad spread of statistical factors. Achievements are measured relative to the horse population as a whole (and sometimes market expectations), rather than being specifically based on individual performance. Twenty factors are used within the calculation and this rating rank is likely to be the most closely aligned with market expectations for an upcoming race. |
| RPP | The Neural Rated Price - when looked at over a very large sample, will generally have a strike rate which is in line with the winning probability associated with that price. |
| WP20R | Traditional Weight or Class Rating Rank. |
| WP20P | Traditional Weight or Class Rating Price. |
| WPTP20R | Time Adjusted Weight or Class Rating Rank. |
| WPTP20P | Time Adjusted Weight or Class Rating Price. |
| ClsDiff | Class Change indicator shows traditional ‘weight-style’ class movement . A –ve value indicates a class drop compared to the previous start. |
| ATWC | Actual Traditional Weight Class figure. |
| AveATWC | Ave Track Traditional Weight Class figure. |
| ScRank | Sectional Time Rating Rank - each runner is rated purely using their last 600m sectional time. All other comments relating the overall race time rating (above) apply to the sectional time rating. The unique aspect of this rating is that we have individual sectional times (spanning several years) on which to base the rating, available for all runners, across most metropolitan, provincial and country race meetings conducted throughout Australia. |
| SPrice | Sectional Time Rating Price. |
| TabNo | TAB Number. |
GetBenchmarksMonth API:
| URL Format: | http://www. puntingform.com.au /api/ratingsservice /getbenchmarksmonth /all?&apikey= xxxxxxxx-xxxx-xxxx -xxxx-xxxxxxxxxxxx |
|---|---|
| Notes: | Returns the last 30 days of Benchmark data. Output as CSV, State selector all? can be replaced by Vic? Qld? Etc. This API requires a subscription to Sectional Pro Form (SPF). |
| Column Heading | Description |
| Date | Meeting Date. |
| State | State. |
| Track | Track Name. |
| Race Number | Race Number. |
| Distance | Race Distance. |
| TAB Number | TAB Number (TAB Number = 0 is assigned to the race leader at the various points of call). |
| Horse | Horse Name (TAB Number = 0 is assigned Horse Name = "_Race Leader"). |
| Position | Position at Finish. |
| Margin | Beaten Margin at Finish. |
| To600All | From Start to 600m comparison against All Average Benchmark. All Bmark Variation Lengths is a comparable average figure across races (normalized for distance) and is independant of class or location. -ve Lengths variation from benchmark indicates faster than benchmark. +ve Lengths variation from benchmark indicates slower than benchmark. Note: The benchmark reflects prevailing conditions (track & distance, going, wind, etc). |
| Last600All | From 600m to Finish comparison against All Average Benchmark (figure is directly comparable across all races). |
| FinishAll | From Start to Finish comparison against All Average Benchmark (figure is directly comparable across all races). |
| To600Class | From Start to 600m comparison against Class Average Benchmark (figure not directly comparable across races of different class). |
| Last600Class | From 600m to Finish comparison against Class Average Benchmark (figure not directly comparable across races of different class). |
| FinishClass | From Start to Finish comparison against Class Average Benchmark (figure not directly comparable across races of different class). |
GetKeyBenchmarks API:
| URL Format: | http://www. puntingform.com.au /api/ratingsservice /getkeybenchmarkstext /06-mar- 2016 /sunshine%20coast?& apikey= xxxxxxxx-xxxx-xxxx -xxxx-xxxxxxxxxxxx |
|---|---|
| Notes: | Output as CSV. The track name (note the use of %20 to indicate a space) and date are altered to suit the meeting details you wish to return. This API requires a subscription to Sectional Pro Form (SPF). |
| Column Heading | Description |
| Date | Upcoming Meeting Date. |
| State | State. |
| Track | Track Name. |
| Race Number | Race Number. |
| Distance | Race Distance. |
| TAB Number | TAB Number (TAB Number = 0 is assigned to the race leader at the various points of call). |
| Horse | Horse Name (TAB Number = 0 is assigned Horse Name = "_Race Leader"). |
| To600All1 | From Start to 600m comparison against All Average Benchmark. All Bmark Variation Lengths is a comparable average figure across races (normalized for distance) and is independant of class or location. -ve Lengths variation from benchmark indicates faster than benchmark. +ve Lengths variation from benchmark indicates slower than benchmark. Note: The benchmark reflects prevailing conditions (track & distance, going, wind, etc). For Last Start. |
| To600All2 | From Start to 600m comparison against All Average Benchmark. For 2nd Last Start. |
| To600All3 | From Start to 600m comparison against All Average Benchmark. For 3rd Last Start. |
| Last600All1 | From 600m to Finish comparison against All Average Benchmark. For Last Sart. |
| Last600All2 | From 600m to Finish comparison against All Average Benchmark. For 2nd Last Sart. |
| Last600All3 | From 600m to Finish comparison against All Average Benchmark. For 3rd Last Sart. |
| FinishAll1 | From Start to Finish comparison against All Average Benchmark. For Last Start. |
| FinishAll2 | From Start to Finish comparison against All Average Benchmark. For 2nd Last Start. |
| FinishAll3 | From Start to Finish comparison against All Average Benchmark. For 3rd Last Start. |
| To600All3Ave | From Start to 600m comparison against All Average Benchmark. Average for Last 3 starts. |
| Last600All3Ave | From 600m to Finish comparison against All Average Benchmark. Average for Last 3 starts. |
| FinishAll3Ave | From Start to Finish comparison against All Average Benchmark. Average for Last 3 starts. |
Today's random quote for quiet contemplation…
Nobody has ever bet enough on the winning horse.
Richard Sasuly (1913-2011; a horseracing and gambling historian)
Today's comment from one of our valued Punting Form Clients…
I'm lost without Punting Form. It has become the most important tool I use when 'doing the form' and has helped take my form analysis to a new level. Punting Form not only provides accurate sectional and overall times for meetings right across Australia but it displays them in a way unrivalled by its competitors. And it's not just about the sectional times either. There are a host of different features across the website which make punting so much easier. I would recommend Punting Form to any serious punter.
Brad Davidson (racing Journalist for the Gold Coast Bulletin)
About
sectionaltimes.com.au is a 'niche' website published by Punting Form. A full range of products and services can be viewed on our 'parent' website, where all the heavy-lifting gets done using Amazon Web Services and an SQL Server Database for content delivery.
